The Moral Panic, Its Perpetrators, and Its Victims
I have done something like this before - tracking a poor and a rich ZIP code through the timeline of our offenses. It’s time for an update. I hope that this can provide a concise and comprehensive picture of the confusion and devastation of the mortgage moral panic.
Here, I will be comparing 2 ZIP codes in Atlanta. ZIP code 30022, where the average income is currently about $190,000, and ZIP code 30344, where the average income is currently about $50,000.
The Selective Collapse
Figure 1 shows the typical price/income ratio in the rich (red) and poor (black) ZIP codes, over time. The price/income ratio in the rich ZIP code approximates a straight line. The price/income ratio in the poor neighborhood approximates a straight line until 2008. The 3x - 4x levels of price/income in the period before 2008 are pretty common for amply housed cities with normal markets, for those of us old enough to remember one.
Figure 2 shows the rate of new construction in Atlanta for single-family and multi-family.
Let’s just run very quickly through a list of some of the big stories about housing. One popular story is that homebuilders have consolidated and are oligopolistically keeping construction low to raise prices. This suffers from the same problem as most of the wrong explanations by treating the demand collapse from 2008 to 2012 as a state of nature or a return to normalcy, and then benchmarking to the 2012 market conditions. There was no construction oligopoly in ZIP code 30344 in 2012. There was nothing. There was scorched earth. Of course, on the long path from scorched earth back up to something near a functional equilibrium, builders were consolidating. There has also been industry consolidation for ox-drawn plows and typewriters.
The decline in building was in low-priced new homes. Builders will claim that they can’t build for the low end of the market because their costs are too high. Costs may be high. Productivity in construction has been poor for a long time and there are creeping regulations. But everything looks like a cost problem to builders. In 2012, when the existing homes in ZIP code 30344 were selling for 1.5x incomes, the builders couldn’t profitably build new homes at that price.
If rising costs of affordable tier housing were the problem would existing homes have been selling for 1.5x incomes or for 6x incomes?
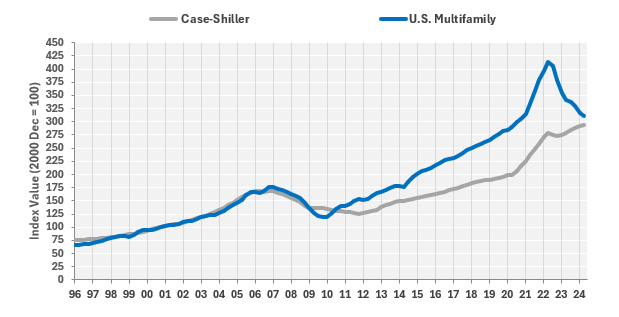
Also, at odds with that, apartments, which generally face more stringent local regulations and are generally smaller and more complicated to build, recovered faster and more completely than single-family construction. They recovered more quickly on price too. Figure 3 compares the Case-Shiller estimate for single-family home prices to the Costar estimate of multi-family home prices.
I suppose this price data could support the idea that, specifically, the cost of building apartments has increased. But, if that was the case then apartment construction would have remained low and cheaper single family construction would have increased.
Oligopoly can’t explain multi-family because construction has increased in multi-family since 2008. And it can’t explain single-family because lower construction activity was associated with lower relative prices.
Others believe there had been a bubble and so they still maintain that from 2008 to 2012, home prices in ZIP code 30344 followed a predictable and unsurprising path. Dean Baker recently blessed us with this observation.
There is a supply version and a price version of that assertion. Baker asserted the price version, which is ridiculous on its face when you look at Figure 1. But, the supply version is just as questionable. Where prices had been relatively stable, as in Atlanta, it was because the lending boom before 2008 had supposedly created a massive construction boom. But, construction in Atlanta was no higher in 2005 than it had been in 2000, and then it dropped precipitously in 2006 and 2007. By the time prices bottomed out in 2012, pick any time period length (2 years, 5 years, 10 years, 20 years) and housing construction for that period was the lowest for the period ending in 2012 than it had been in any other period since data have been collected. It’s really astounding how many ways the conventional explanations literally couldn’t be more wrong.
The incorrect explanations tend to all suffer from the same problem. They treat a ridiculously deep disequilibrium as a benchmark. On every margin, the housing market had to correct back from that disequilibrium. The prices of homes in ZIP code 30344 could not possibly remain at 1.5x incomes. And so, all the alternative explanations for what happened after 2012 basically observe things that will inevitably happen after a disastrous credit crackdown (more investors, fewer builders, rising rents, etc.) and construct spurious correlations from them. The entire literature on the post-2008 housing market is an attempt to describe the condition of the china shop with models that don’t include a variable for the bull.
And, by the way, does Figure 3 look like a market where there was a massive lending boom in single-family housing before 2008 that ended and returned the market to normal? Or does it look like a single-family housing market that was completely unremarkable until a bomb got dropped on it in 2008?
Libraries are full of papers and books about an unsustainable divergence in single-family housing before 2008 and, in general, there isn’t even curiosity about any divergence after 2008.
One more thing to note in Figure 1 is that price/income has recovered in ZIP code 30344 to a level well above the pre-2008 norm. New homes get built when the prices of existing homes are higher than the cost of constructing new ones. If the Atlanta market was producing new housing across both high and low tiers before 2008, then it should be producing new homes today. But, as Figure 2 shows, single family construction is still less than half the pre-2008 norm. This should be inducing new construction.
There are a couple of caveats here. It is possible that higher costs, changes in policies like property tax rates, or other marginal changes might have pushed up the break-even price/income level. In most cases I don’t think those issues would add up to a lot of change on this margin. Where construction costs are high, consumers don’t increase their housing budget. They mostly change the housing they consume. Average home size has been declining for a while. That could be related to rising costs, but everywhere that housing takes a larger portion of incomes, it is from inflated land value. (Sometimes local jurisdictions do load additional costs onto structures, but that is a side effect of the inflated land values.)
Since the effect of inadequate supply is to raise the land value under existing homes, it could be the case that new homes in ZIP code 30344 would require prices more than 5x local incomes instead of 4x incomes and the extra cost would be the cost to buy the land. Until more homes are built somewhere in the metropolitan area, there could be parts of the metropolitan area where elevated land costs make homes more expensive. And, the poorest ZIP codes are where those effects are most pronounced. So, it may take higher prices in ZIP code 30344 to induce new building.
All that being said, this is one reason I expect to see continued growth in the new single-family build-to-rent market. Prices in the 30344 ZIP code had just recovered to more than 4x incomes when Covid hit and supply chains got clogged up. We have been in that condition for 4 years while prices continue to rise. More homes can be economically built in Atlanta today, once the capacity returns to complete them.
In Figure 4, I compare the nominal price according to Zillow for these two ZIP codes and for Atlanta. It’s on a log scale to highlight the trends. The Atlanta average is just halfway between the relatively straight line of rich ZIP codes and the relatively straight line with a huge crater in the middle for poor ZIP codes.
The point I want to get across here is that the typical home price in ZIP code 30344 reached as low as $50,000. When you benchmark to 2012, whether its lending hawks, permabear Fed critics, private equity critics, etc., that’s what you’re benchmarking to. You’re saying $50,000 is a reasonable price level for a house in an American city, and any trends pushing it higher than that are excessive.
If $50,000 really is the benchmark, normal price level for ZIP code 30344, then, what that means is that over the long-term, the typical family in ZIP code 30344 should be living in a house that would cost $50,000 to build. If it was wrong for private equity to bid up the price of those homes above $50,000; if homes in ZIP code 30344 are more than $50,000 because the Fed held interest rates too low or the FHA lets borrowers take out loans with DTI levels that are too high, etc. then the standard you are enforcing is that large sections of Atlanta should live in hovels. Because that’s what you could build for $50,000.
The reason private equity activity is associated with rising prices is because they were the only legal buyers when prices were too low. And prices were too low because private equity was the only legal buyer. And private equity activity is associated with rising rents because rents rise when builders can’t build, and builders don’t build when the price is too low.
Which brings us to Figure 5. Figure 5 shows the price/rent ratios of Atlanta and these two ZIP codes (1). The price/rent ratio of the poor ZIP code was just a bit below the Atlanta average before the 2008 crisis - in the teens. Then it dropped to 6.
Housing is almost always a much better deal for residents with lower incomes than it is for residents with higher incomes. The yield on an investment in an affordable home is almost always higher than the yield on an investment in fancy homes in rich neighborhoods. That’s why local mom and pop landlords operate in more affordable neighborhoods. We made those homes even better investments by preventing their tenants from buying them.
Notice, also, that the price/rent ratio in the richer ZIP code is about the same as it was in 2007. But, it is still quite a bit lower in the poorer ZIP code. Prices have fully recovered in the poorer ZIP code, but rents have risen much more.
Benchmarking to 2012 and measuring the effect of private equity from that point on as if the causality begins in 2012 is currently the state of the art among economists and sociologists. I can sort of understand why. The explanation for what happened between 2008 and 2012 isn’t even on the drop down menu. How would you even proceed with analysis of the entire period since 2008 with this big, unexplained discontinuity. Statistics would be useless. The orthodoxy says you can benchmark to 2012, and it solves that statistical problem. What a relief if you’re trying to get a publishable paper done!
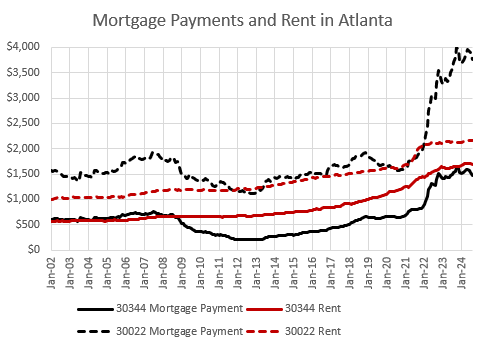
So, what do mortgage payments and rents look like in these two ZIP codes over time?
Figure 6 compares them. The richer ZIP code is dashed. The poorer ZIP code is solid. Mortgage payments are in black. Rents are in red.
As I wrote, owning is always more financially advantageous for families with lower incomes in cheaper houses than it is for richer families in expensive houses. In 2007, a typical house in the rich ZIP code rented for about $1,150, and owning it would take a mortgage payment of about $1,900. In the poorer ZIP code, either renting or owning would have taken a monthly payment of about $700.
That is highly advantageous for the homeowner because rents rise over time but the mortgage payment is fixed while the home value will tend to rise with its rental value. The owner does have some maintenance and tax expenses, but overwhelmingly ownership is advantageous. The relative difference between the rent and mortgage payments in the richer ZIP code is probably a good estimate of how advantageous ownership is. It’s worth more than a 50% premium in monthly payments at the time of purchase.
So, in 2007, residents of ZIP code 30344 who could qualify for a mortgage and own a home were pocketing a 50% premium that richer homeowners must pay.
By 2012, the typical home in ZIP code 30344 still fetched a rent of just under $700, but by then you could buy that home with a $200 mortgage payment. This is why it is clear that “affordability” isn’t the problem here. Millions of families aren’t being locked out of homeownership because interest rates are high or because they can’t qualify for a large enough mortgage to buy the houses they want.
They couldn’t get mortgages when they could replace a $700 rent payment with a $200 mortgage payment. And, that was the state of the market for more than a decade. I cannot answer with an auditor’s specificity all the ways in which mortgages are being denied. But we don’t need to. Underwriting is completely broken. How do we fix this, on the margin? We can’t. Burn it down. Burn it to the ground. Unwind the entire post-2008 underwriting apparatus at the federal agencies and federal regulators. Go back to late 1990s standards and start over.
“How can we tweak underwriting on the margin so that $700 renters can get approved for a $200 mortgage?” is such a ridiculous question to have to ask that it is an insult to the process of healing to even try to answer it.
I know it is natural, if you haven’t completely thrown the conventional bubble stories in the trash, to see returning to pre-2008 lending norms at the agencies and banks as reckless. To the contrary, not doing that is reckless. Every day that working class families are paying half their incomes in rents that just keep rising is reckless. The only way that going back seems reckless is to engage in a staggering scale of status quo bias. If you’re careening through a neighborhood at 90 miles per hour, slamming on the brakes is the only non-reckless choice.
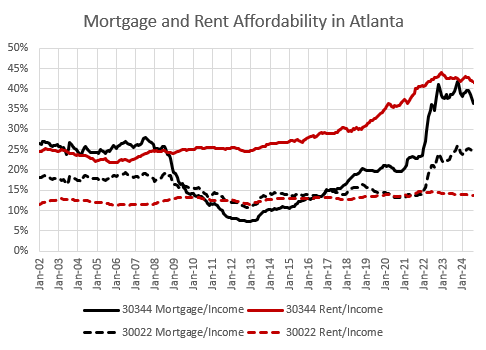
Finally, Figure 7 puts it in affordability terms. What percentage of a typical family’s income goes to rent or mortgage payments?
In the richer ZIP code, in 2007, rent took about 11% and a mortgage took about 19%. In the poorer ZIP code, rent took about 24% and a mortgage took about 27%.
For most of the period where private equity has supposedly been pushing home ownership out of the reach of families, the families of ZIP code 30344 could have cut their monthly expenses in half by buying their homes. Nobody was pricing them out of anything. Two decades into this, it’s long past time to stop being ridiculous about this. You and I, and the representatives we send to Washington are the only thing keeping those families from owning those homes.
In all cases, payments for housing are higher than they were before 2008. The rent in the richer ZIP code went from 11% to 14% of the typical tenant’s income. The mortgage payment used to take 19%. Now it takes 25%.
In the poorer ZIP code, the mortgage payment went from 25% to nearly 40%, but that was entirely because of the lack of new construction. So, their rents have risen from 24% to 42%. But, while in 2007, buying a home would have slightly raised their monthly payment, in 2024 it would reduce their monthly payment.
Their rents have risen higher because we stopped letting them buy homes. (And we don’t let builders build apartments which could have substituted for those missing homes.)
Rents have risen far enough that a single-family build-to-rent market is taking off in Atlanta. That should at least stop rents from continuing their unprecedented rise. Allowing more apartment construction would also help. And allowing more generous underwriting, like we did before 2008, would slowly return all these measures to their 2008 levels. Price/rent ratios in ZIP code 30344 would rise, but that would mostly be due to declining rents.
Low interest rates, down payment assistance, mass deportation, a recession, banning Wall Street. None of those things will make a dent in the problem of high housing costs. But, until the average Joe, or at least the average pundit, has a model of the housing market that can explain why working class families weren’t choosing to buy homes in the 2010s with mortgages that would claim less than 10% of their incomes, we will be uselessly debating the 37 theories about why all this china got knocked off the shelves.
(1) Zillow only estimates rents from 2015 to the present. For the years 2002 to 2014, I estimate rents by fitting Zillow rent for Atlanta from 2015 through 2019 to the CPI estimate of rent inflation for Atlanta, and then use the CPI data as a proxy for rent trends before 2015.


If you are wondering why there is so much anger and discontent in lower-income communities...housing costs play a major role.
Why should people in low- and moderate-income communities believe in the "the system" if housing costs soar?
It is hard to dodge housing costs.
Rather than decide what is "normal" directly, I'd try to look for policies: regulations regarding bank lending, building codes, zoning/land use regulation, interest rates (?) and show how this would differentially affect the demand by lower income people and supply of lower cost housing. After all, the whole reason for doing the analysis is presumably not just to help builders better target the market, but what policy makers can do to allow more development.
This did not come through for me.