
Mortgage Affordability

In the recent post about anti-investor bills, I made the following comment:
In Atlanta, the 37th percentile home value appears to be about $325,000. So, I looked up a couple, randomly, in Zillow. One says the mortgage payment on a refi would be $1,934 and it would rent for $2,544. One says the mortgage payment would be $2,264 and rent would be $2,802. Oh, those poor home buyers getting priced out of ownership by the big landlords. (Homeowners have additional expenses, but the payment is fixed while the rents will rise each year.)
My point was a very basic one: If the marginal homebuyer is paying more in rent than they would pay for a mortgage on the same house, then it is not credible to claim that investors are specifically creating an affordability problem for homebuyers. Anyone in Atlanta that has enough cash each month to rent a house also has enough cash to buy one. If anything, there needs to be more investor activity to claim more homes for renters. Pushing prices up and rents down would be a move toward equilibrium, not away from it.
But, here I want to make it clear that my point begins and ends there. The affordability of homes does not depend on mortgage payments being lower than rent payments. You should not consider mortgage affordability to be a useful measure for forecasting home prices. And you should not count on it reverting to a stable mean. I have written about this a few times before. I will add some new notes here, hopefully not repeating those old posts too much.
There are a number of errant priors that tend to muddle this topic. If we think in terms of a neutral mortgage payment/rent ratio, that ratio is determined by two factors - price/rent ratios and mortgage rates.
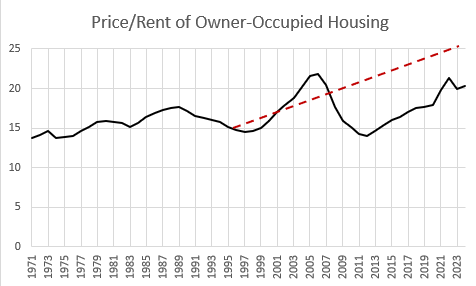
The first muddle is that economic canon says the 2000s were a cyclical bubble, so that price/rent ratio was unsustainable. In truth, rising rents cause price/rent ratios to rise, because the additional rents are on the land, which trades at a higher multiple. Really, most of the change in price/rent ratios over time has been the result of land rents taking up a larger portion of the price of the average home.
It is more accurate to think of American home prices as being on a persistent upward slope, with a big fissure in 2008 when we tried to fix a supply problem with a credit shock. (And, yes, prices were also cyclically buoyant before 2008, so if neutral price/rent ratios are on a straight upward slope, price/rent ratios in 2005 were a bit above that level. The dashed red line is roughly the price/ratio trend without cyclical deviations and the discount created by the mortgage crackdown.)
I think a decent shorthand for measuring US home prices over time is that the average structure sold for about 12.5x rent before 2008, and sells for about 10.5x rent since the mortgage crackdown. The land under the average house sells for about 36x the elevated rent on the land associated with regional housing shortages.
Why does this matter? It matters because if you think the 2000s housing market was purely a bubble - full stop, period, put a wax seal on it - then clearly the mortgage/rent ratio was too high in 2005. You might benchmark to the ratio in the 1990s, or worse, the ratio in the 2010s.
In fact, the ratio isn’t really elevated at all. The US housing market hasn’t been in a 50 year stasis. It has been in a 30 year inflation because of a shortage of units. Land rents are elevated, so that price/rent ratios are elevated, so that at any given mortgage rate, the neutral mortgage/rent ratio will be higher than it used to be.
And, since higher rents push the mortgage/rent ratio up, mortgage affordability (the percentage of the average income required to make payments on the average home) is doubly up. Rent affordability is inflated, and mortgage affordability is inflated relative to that.
By using a mortgage/rent ratio, I am actually muting the apparent price anomaly that a straight mortgage affordability measure would suggest.
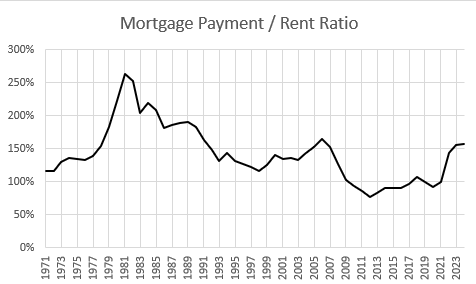
But forget all that. Mortgage affordability isn’t mean reverting. There is no neutral. There wouldn’t be a neutral rate even if American housing markets had been in stasis. That’s why the ratio was so high in the 1980s and its how it got so low in the 2010s. Because mortgage rates have a very weak pull on home prices.
And, furthermore, the fact that there are many homes, even at today’s mortgage rates, where the mortgage payment would be lower than the rental value of the homes, is really odd. In every community, under normal conditions, where access to mortgages is common and families make the buy vs. rent decision freely, the mortgage/rent ratio is commonly higher than 100%.
In fact, you can see that by comparing Figure 2, above, to Figure 7, below. Figure 2 is based on owner-occupied homes. Figure 7 is based on all homes. (Figure 2 is also based on BEA and Federal Reserve data while Figure 7 is based on Zillow data, so there is also potentially a difference in methodology. But, this is generally the pattern.) More expensive homes tend to have higher price/rent ratios and higher mortgage/rent ratios. Owner-occupied homes tend to be more expensive.
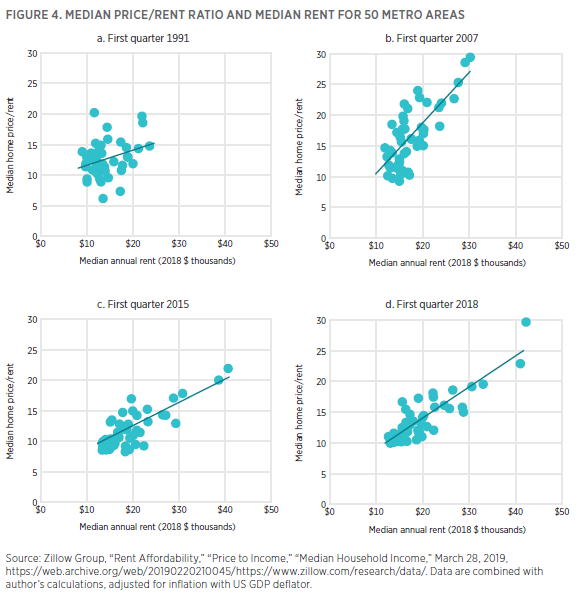
I discussed this in my Mercatus research paper “Rising Prices Are Mostly from Rising Rents”. Figure 4 is from that paper. Rising price/rent ratios have been due to rising rents. Expensive cities have higher price/rent ratios, and, therefore, mechanically, they have higher mortgage/rent ratios. And, since they also have higher rents, mortgage/income affordability in the expensive cities is much higher.
In Figure 5, you can see that the mortgage/rent ratio increased in all cities when mortgage rates increased in 2022. But, the most expensive cities in 2021 had higher mortgage/rent ratios than the cheapest cities have today.
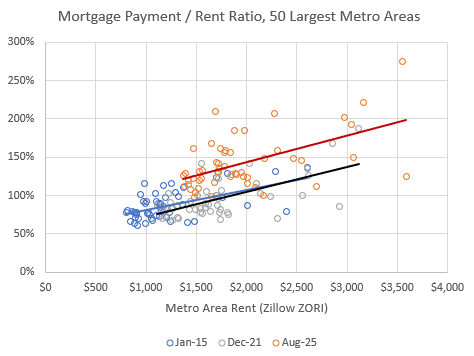
One way to think about Figure 2 is that the mortgage/rent ratio is higher in Los Angeles than in St. Louis, and every city has become more like Los Angeles since 2008, so the same mortgage rates produce higher mortgage expenses today.
Rising rents create rising prices, and rising price/rent ratios, and therefore create rising mortgage/rent ratios.
Mortgage rates have a very weak effect on home prices, therefore rising mortgage rates create rising mortgage/rent ratios. The reason rising mortgage rates create rising mortgage/rent ratios is because mortgage rates don’t move prices substantially.
By the way, there are other factors, like property taxes, that can change the mortgage/rent ratio if you don’t include taxes and insurance in the mortgage payment estimate. (I have not gone to that trouble here.) But, higher property taxes should raise rents and lower prices. In other words, if property taxes were driving the differences in price/rent ratios in Figures 4 & 5, the regression line would slope down.
Figure 6 compares time series of the mortgage/rent ratio in a few cities. So, what’s the neutral mean that mortgage/rent is supposed to converge to? If it’s 120% in Seattle, why is it 95% in Minneapolis and 65% in Detroit? On these individual comparisons, things like different property tax rates could explain a lot of the difference, but, again, systematically it does not explain most of these differences between all cities, because the regression lines in Figures 3 & 4 slope up - higher rents are associated with higher mortgage/rent ratios.
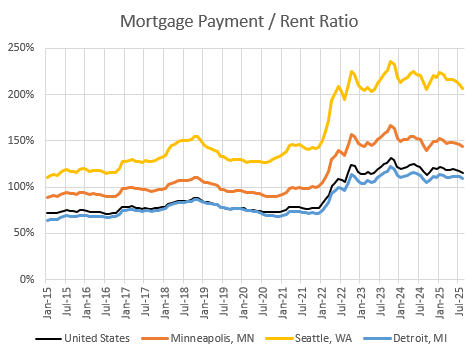
And, surely, cities weren’t born with a set mortgage/rent ratio, each with its own unique stable mean. Their ratios differ from each other because the cities have changed over time. The main way that they have changed is that each city has a shortage of a different scale. Here, they happen to line up in order of the scale of their shortages. Detroit, Minneapolis, and Seattle.
And, this creates a trick of the eye which further dooms the conventional analyst.
Keep reading with a 7-day free trial
Subscribe to Erdmann Housing Tracker to keep reading this post and get 7 days of free access to the full post archives.