
No. Fed stimulus doesn't hurt first-time homebuyers

I do not have a PhD level training in the statistics, so maybe I’m out of my element here. But, here is a paper, by Leonel Diego Drukker at UC Berkeley, being shared about mortgage rates and home ownership that I think reflects the inability of the economics academy to create helpful and relevant analysis of the post-2008 housing market.
The paper models mortgage rates as an outcome of monetary shocks and then claims to measure the effect of those shocks on first-time homebuyer share.
It measures a 1:1 effect of mortgage rates on home prices (0.25% decline=0.25% price increase) and a 1:3 effect of prices on first-time owner share (0.25% price increase=0.77% decline in share).
So, if I understand the conclusion, a 3.5% decline in mortgage rates (attributed to monetary shocks) is associated with an 11% decline in the share of first time homebuyers, motivated by a 3.5% increase in prices (and down payments).
I would question several points in the causal inference here. Beyond short term temporary shifts, I would say that Fed rate decisions don’t cause large permanent sympathetic changes in long term rates. Over the long-term, the causality seems to be in the other direction. The neutral short term real interest rate targeted by the Fed is determined by supply and demand conditions that determine long-term rates. And, the Fed communicates changes in money supply by making small changes around that neutral rate in very short-term lending markets.
I think the long-term effect of mortgage rates on home prices is weak and the effect on sales activity is short-lived. I suppose this is little more than a hunch motivated by my inability to find important long-term correlations between rates, prices, and activity in the data. I suspect that when there is an unexpected change in mortgage rates, there is a shift in short-term buying activity. Potential buyers in the market become motivated, and contracts that would have been signed in June are signed in April instead, with little effect on the number of contracts signed or prices in August. I think this inevitably leaves builders with an overly confident notion of how important interest rates are in driving revenues. They really do have an effect over short periods of time, so it is hard to overcome that confidence. And when the Fed is on the wrong side of neutral as recessions develop, they have to chase the changing neutral rate down to stop the economy from shrinking, which creates a context where eventually, the declining target rate is associated with improving market conditions.
The results reported in Table 1 of this paper seem to support my hunch. The author finds that a -0.1% surprise in mortgage rates leads to a 0.19% surprise in home prices within 2 weeks, which decays to a 0.10% surprise by weeks 5-6.
From 2009 to 2020 high home prices were not a binding limit to first-time homebuyers relative to previous years. Prices were unusually low and mortgage affordability was unusually easy throughout that period. I think the paper makes some reasonable causal inferences about short-term changes which are not cumulatively important and whose estimates may be inflated by the lack of attention to major changes in credit access during the period.
The analysis appears to attribute cause based on idiosyncratic movements in rates, prices, and first-time homebuyer activity, which it accumulates over time so that those changes appear to explain almost all of the change in first-time homebuyer activity over a period of time where mortgage rates, home prices, and first-time borrower activity all moved around linear trends. Figure 1 is from the paper. I have added the straight lines to indicate the time period covered by the analysis.
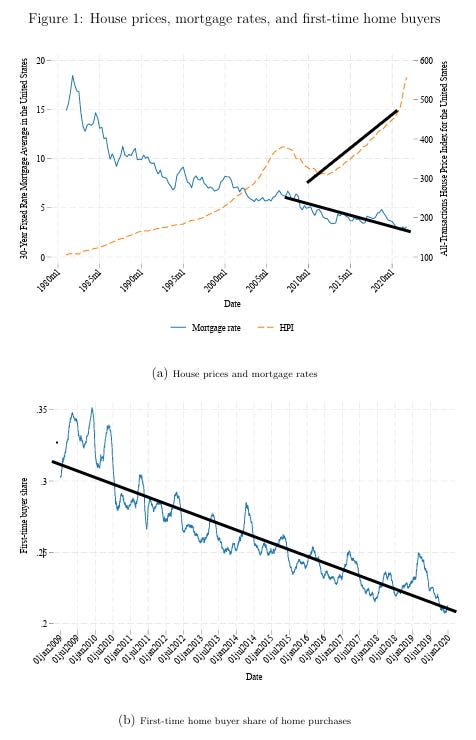
Before doing any statistical analysis, upon seeing these trends I would have said that the most likely explanation is that in 2008 there was a shock to mortgage access which permanently lowered the number of homeowners and that by 2009 also temporarily lowered the prices of existing homes such that existing homeowners frequently had negative equity. Low prices led to a sharp decline in construction and a new rise in rents and prices from the temporary lows. As prices increased, more existing homeowners re-entered the market as they could sell their homes at prices that could cover their mortgage principal, and that lowered the portion of first-time homebuyers.
Both repeat and first-time homebuyer activity dropped by roughly half from 2004 to 2009. The change shown in first-time buyer share after 2009 is due to recovering repeat buyer activity between 2009 and 2020 rather than declining first-time homebuyer activity.
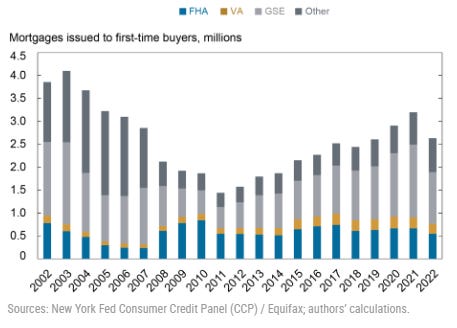
In fact, according to the New York Fed (Figure 2), the number of first-time buyers was increasing during those years. So, it seems that if we are going to center mortgage rates as a causal element in homebuying activity, then maybe it is more accurate to say that declining rates helped first-time homebuyers, but not as much as they helped repeat buyers. And, of course, since this is not a fixed pie world in spite of all of that happened, the improvement in access played out in rising construction activity.
A side note: the subprime boom, which strictly operated between late 2003 and early 2007, was associated with a decline in first-time homebuyers. This was one of the broadly ignored trends that led me to blog my original doubts about the housing bubble conventional wisdom that became my first book, Shut Out.
We should also consider the huge swings in trends of home sellers, which is also not accounted for in the measure of the share of buyers who are first-time buyers. Net activity of existing homeowners is essentially always negative, and there were huge swings in the pace of selling during this period - both voluntary and because of foreclosures.
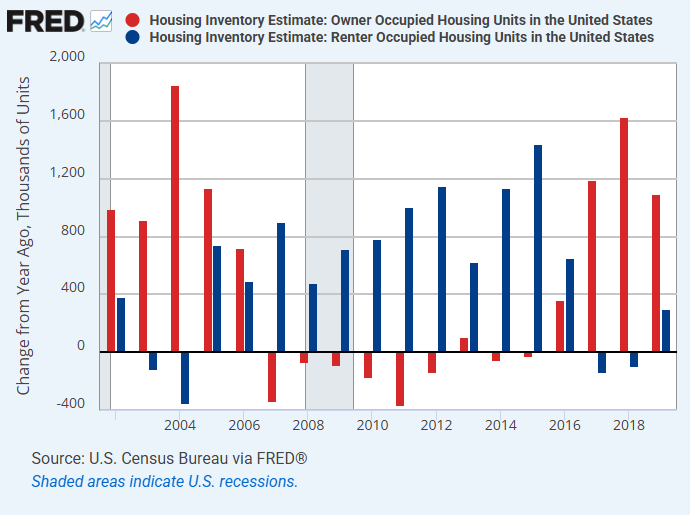
Also, this points to another side note. The number of new homeowners, after accounting for buyers and sellers, shown in Figure 3 by the red bars, briefly peaked in 2004 and then dropped sharply throughout the rest of the subprime boom leading up to the Great Recession.
According to Figure 2, there were nearly 3 million first-time homebuyers in 2007 but the total number of homeowners declined that year.
Of course, somewhat famously, mortgage rates during that period weren’t responsive to a rising Fed Funds rate. Though, again, maybe they were responsive to surprises in changing Fed Funds rates in the short term, but not in a cumulative way over months or years.
But, in any case, if we are going to center rising Fed rate targets as a causal element in housing markets, maybe you could say the same thing about that period as you might say about the conclusions of this paper for the period after 2008 - but in the opposite direction. Maybe rising rates were hurting first-time homebuyers, but not nearly as much as existing homeowners.
Here’s the abstract:
This paper investigates the mortgage channel of monetary policy transmission to home purchasing behaviors of first-time home buyers and incumbent homeowners. Between 2009 and 2019, the first-time home buyer share of home purchases fell from 35% to 22%, a period in which mortgage rates fell from nearly 7% to 3.5%. First, I construct a new mortgage rate-specific monetary policy shock to use as an IV for mortgage rate changes which predicts future mortgage rates better than existing monetary policy shocks. Next, I provide empirical evidence for three new findings: 1) transacted house prices respond to monetary policy-induced mortgage rate changes within a matter of weeks, indicating a rapid housing demand response to mortgage rates; 2) a negative 25 basis point mortgage rate shock lowers the first time buyer share of home purchases by 77 b.p. in the first three months after the shock; 3) these results are more pronounced in areas with higher shares of high LTV-constrained borrowers which tend to be areas with more severe housing crises. Finally, I construct a lifecycle model with a housing ladder, heterogeneous agents, and a system of housing-related taxes calibrated to my empirical findings. I find that a one-time unanticipated negative one p.p. transitory shock to mortgage rates causes potential first-time home buyers to face 0.05% consumption-equivalent welfare losses.
It is implausible that a 3.5% decline in mortgage rates led to an 11% decline in first-time homebuyer share when mortgage affordability was so easy at the end of the period. And for much of this period, construction activity was very low with capacity that builders were very motivated to use where there were buyers.
Here are some assumptions used in one of the paper’s models. “The set of housing outcomes H comprises of four states: a renter state, a starter homeowner state, a large homeowner state, and a second-homeowner state. The aggregate stock of non-rental housing is fixed, i.e., there is no housing construction or depreciation, and non-rental housing is owned entirely by households. Following the results from Guren and Greenwald (2025), rental markets are perfectly segmented and, for simplicity, I further assume that the stock of rental housing perfectly matches rental demand and is owned by outside landlords who charge a fixed per-period rental price q.”
Be very careful about making inferences from the 2010-2020 housing market with those assumptions. Maybe I overuse this analogy, but, this is like measuring the change in the water table in New Orleans in 2005 while assuming no rainfall.
During this period, a lack of supply has probably been associated with a shortfall of millions of formed renter households.
The paper also notes, “Given the empirical results shown in Appendix Figure A4 that the majority of the response to changes in the house price-to-rent ratio from mortgage rate shocks are due to house price movements and not rent price movements, I only solve for house prices and assume rental prices are exogenously set.”
Again, I would agree with high confidence that short-term changes in prices are unrelated to short-term changes in rents. And I would disagree with equally high confidence that this translates to the long-term. In the long-term, rents effectively explain all price changes (and higher price/rent ratios are associated with higher rents).
These issues remind me of that Quintero paper that is widely cited as evidence that industry consolidation led to metering of sales among homebuilders after 2008. These papers are inadvertent tests of the statistical robustness methods that were used to establish causality. The methods failed the test. Bumblebees can fly.1
I suppose you could say that if the Fed had pegged the mortgage rate at 7% in 2020 that it would have increased first-time homebuyer share by cratering the repeat buyer market. But the idea itself that the Fed could have created 7% mortgage rates in 2020 would be nonsensical. The crisis in 2008 came about, in part, because they couldn’t even manage to peg their target rate to 2%, and they sucked hundreds of billions of dollars out of the economy trying to get to it.
It also reminds me of a paper I previously posted about that purported to show that declining mortgage rates over the past 40 years were caused by Fed rate decisions. I don’t think this paper cites that paper, but it has a similar problem, in that it limits its quantitative analysis to the period with uniform linear trends in the variables of interest. The recent change in those trends to rising interest rates provides the opportunity to test the theory out of sample, and I found that the paper attributing long-term rates to Fed rate decisions failed the test. This paper uses a different method to claim that Fed rate changes are reflected in mortgage rates. But, I think it will have a similar problem being tested out of sample.
In fact, in the conclusion, the author writes, “However, when mortgage rates rose in 2022 and 2023, prices did not fall, a feature the current calibrated model does not capture.” Drukker offers behavioral finance and market friction explanations for why. His mentors should not have let it get that far, but it seems as though nobody in the academy has a map of the important forces in American housing markets over the past 30 years that can get them from point A to point B.
My main point here isn’t my doubts about the paper. My point is that, again and again, groups of mentors in economics programs appear to be completely unaware of important counternarratives that new analysis needs to be checked against. At some point, every paper comes to a “process of elimination” moment, and the state of the art in economics doesn’t seem to include some significant facts about the economy that must be included in that process.
PS:
Drukker uses debt-to-income (DTI) and loan-to-value (LTV) constraints as the mechanisms that limit buyer activity. If lower mortgage rates lead to higher home prices, then existing homeowners can pay the higher new required down payments with capital gains while first-time homebuyers can’t. This is one of the primary mechanisms that he suggests for why low interest rates favor existing homeowners.
Drukker finds that binding LTVs are correlated with changes in first-time homebuyer share, not DTIs. In other words, even though lower mortgage rates make the mortgage more affordable for first-time homebuyers, they appear to be stymied by larger required down payments.
This is an interesting finding, and there are interesting things to say about it. It would be an interesting mechanism explaining why lower interest rates help existing homeowners more than first-time homebuyers, or at least documents a mechanism where rising home prices affect buying activity.
As part of the analysis, he uses DTI cliffs as a constraint for first-time homebuyers.
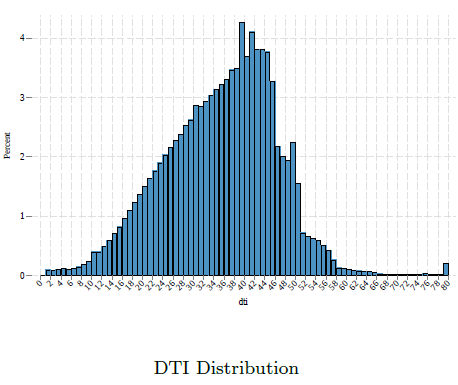
What struck me about this was, “I find that the DTI distribution largely resembles that shown in Bosshardt et al. (2024) in that there are steep cliffs after the 45% and 50% DTI levels. One might expect to see a cliff at the 36% level given Fannie Mae’s default DTI maximum limit; however, Fannie Mae allows a maximum limit of 45% if the borrower provides a higher level of credit worthiness. Additionally, Fannie Mae allows a higher DTI limit of 50% for mortgages underwritten using their Desktop Underwriting automated process if the full set of the borrower’s characteristics (application data, income, financial assets, credit history, and employment history) satisfies their eligibility model.”
Why isn’t there a cliff of originations around Fannie Mae’s default 36% DTI limit? Likely it is because there is no significant amount of lending at any DTI level for borrowers that can’t provide the higher level of credit worthiness. The cliffs at 45% and 50% are demonstrative. There is no cliff at 36% - not even a whiff of an indication that there is any lending happening for buyers to whom the 36% cliff would be relevant.
I would prefer to avoid binary language, but so many times the empirical evidence is binary. There isn’t a smaller cliff at 36%. There is no cliff.
One last tangential point: You can benchmark to the number of first-time homebuyers in, say, 2005 and 2006, and roughly count up a shortage of about 15 million homeowners between then and today, just by eyeballing Figure 2. A lot of that 15 million accumulated from 2008 to 2012 when first-time homebuyers were still nearly 1/3 of home purchases, and prices, mortgage payments, and down payments were all very favorable to buyers during that time.
DTIs and LTVs didn’t create that divot. FHFAs and CFPBs did. Yet, in the YOOL 2025, the academy is greenlighting and mentoring papers that focus on the former to the exclusion of the latter. The academy has failed on this important topic.
Added PPS:
I noted that while the share of first-time homebuyers declined during the period studied, the decline was caused by more activity from repeat buyers increasing the denominator, not a decline in first-time buyer activity. I cited a Federal Reserve source that showed increasing first-time buyer activity from 2011 to 2021.
But, looking more closely at the Fed source, the data clearly differs from the data the paper uses. The Fed source shows relatively flat first-time homebuyer share. And it also shows relatively flat all-cash share, which seems a bit questionable.
So, the very specific point about rising first-time homebuyer activity might not hold up, or at least probably comes from a source that differs. At worst, first-time homebuyer activity was flat, and likely still increased a bit over that time period. And, rising repeat-buyer activity surely is the primary change driving the first-time homebuyer share down in the paper. So, I don’t think it changes any of my complaints, but the difference was notable enough that I thought it was worth mentioning.
By the way, I was reminded of the Quintero paper as I was reading a recent ResiClub post on current Lennar operating outcomes. Lance Lambert notes that Lennar’s incentives (discounts and bonuses for new homebuyers) in the recent quarter were 14% of the list price. For most of the 2010s, it was about 5%. When incentives are higher than 5%, it is a signal of moderating demand. Quintero’s paper covers the period from 2006 to 2015, claiming that causation goes from industry consolidation to less construction over that period. As Lambert’s ResiClub post notes, Lennar was offering incentives above 10% as late as 2012. The idea that builders were using market power to meter sales during that period would be quickly disabused by any 5 minute conversation with a person who was trying to build homes at the time. Derek Thompson has a good review on the topic of homebuilder consolidation.