I think forward interest rates are mostly driven by things like changing economic productivity and sentiment, and that the Fed is mostly along for the ride. I mean, certainly, the Fed could flood the market with cash or suck up all the cash, and I think we can all agree this would have a noticeable impact on the marketplace. If they did that, it would affect future yields, sure.
In the last two weeks there has been a huge change in forward rates but little change in expected rates over the next year or so. Figure 1 compares the yield curve from two weeks ago to yesterday’s yield curve.
The impression I get from some macroeconomists is that they interpret this as a change in expectations about Fed policy. The market has determined that the Fed will have tighter policy after 2026 than they previously expected.
It makes much more sense to me to conclude that something has happened to change sentiments about real future economic activity. Of course, if future real economic growth is higher, interest rates will also likely be higher. So, it is true that if the Fed is trying to maintain a neutral inflation stance, and if they communicate that stance through interest rate targeting, then the Fed’s policy rate will probably be higher.
I think this is just a rhetorical issue. I mean, if we have to use interest rates as our policy reference, then just about everybody would agree that the 2027 Fed policy would be tighter at 4.2% than it would be at 3.8%. But, it seems utterly confusing to me to claim that future Fed policy was the causal change over the past two weeks.
As far as I can tell, there is a school of macroeconomists who say, “Long term bond yields are a product of the cumulative future rate decisions of the Federal Reserve.” and they really mean it, in a causal sense.
A paper that I see shared a lot recently as evidence for this Fed causal role is this working paper:
“The Fed and the Secular Decline in Interest Rates”, by Sebastian Hillenbrand, Harvard University
Abstract
This paper documents a striking fact: a narrow window around Fed meetings captures the secular decline in U.S. Treasury yields since 1980. Yield movements outside this window are transitory and wash out over time. This is surprising because the forces behind the secular decline are thought to be independent of monetary policy. However, Fed announcements might provide guidance about the long-run path of interest rates. In direct support of such "Long-run Fed Guidance", the Fed’s expectations for the long-run level of the federal funds rate – released through the "dot plot" – strongly impact long-term bond yields.
Dot Plots and Fed Expectations
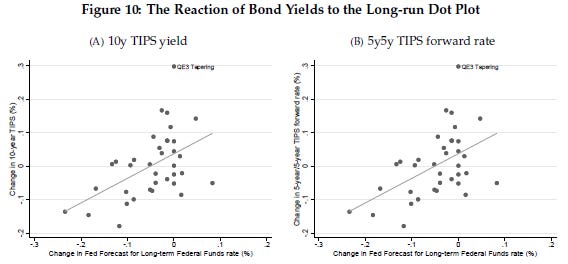
One idea in the paper is that since 2012, the Fed has published a set of committee expectations, including the “dot plot”, which is the committee’s estimates of future Fed rate targets. Hillenbrand finds a statistically significant relationship between changes in the committee’s estimate of the long term target rate and real long term market interest rates around the committee meetings. In other words, the dot plot appears to contain information that traders act on. Figure 2 (Figure 10 in the paper) shows the results.
I feel like this deserves a bit of caution. The paper says the result isn’t driven by outliers, but visually, it looks clear to me that the correlation is largely dependent on about 6 points at the bottom left. Still, it seems likely that a few big downshifts in long-term Fed rate expectations during the slow recovery from the Great Recession were related to a cumulative decline in market rate expectations of close to a full percentage point.
The paper presents this as support for former Fed Vice Chair Stanley Fischer’s assertion that the dot plot has helped to communicate Fed expectations about long term growth potential. I agree. It is. And, I think that is the correct way to look at it. The lower expected future real rate is not a signal of future Fed dovishness. It reflects a Fed expectation of lower expected real growth. And the market response, as I see it, is more a bearish result of that communication. When the Fed has lower or higher expectations for its own success, the market ingests that information.
There is a lot to debate about whether those expectations have been optimal. Those half-dozen negative changes were bearish shifts, not bullish. Those weren’t Fed commitments to future inflation. They were capitulation to stagnation.
The paper’s data extends to 2021. Since then, long-term rates have spiked. The 10-year TIPS yield began 2022 at -1%, and hit 1.7% by October. The Fed’s estimated long-term target rate did not change during that time, remaining at 2.5% throughout. And, none of that rise occurred during Fed meetings.
So, this probably points to something important about 2010s era monetary policy, but the relationship is unlikely to be mirrored on the upside.
The Fed’s Influence on Declining Long-Term Rates
The money shot from the paper is Figure 3 (Figure 1 from the paper), which shows that all of the cumulative changes in the 10 year yield since 1989 have happened during Federal Open Market Committee (FOMC) meetings (including the day before and the day after the committee policy announcement).
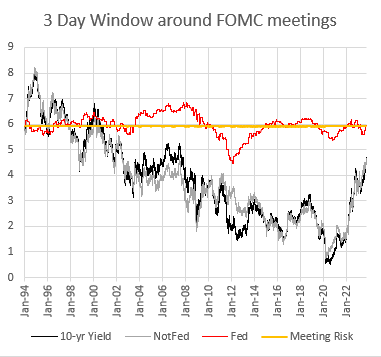
I have been able to replicate this data. Figure 4 is my attempt at creating the same statistical starting point as the paper. I can’t seem to match up the results before 1994. There was a change in Fed presentation standards in 1994, and I must be viewing the earlier data differently from the paper, but that’s ok. I will use the period from 1994 on, and you can see visually that from that point on, there is a very close match between my data and the data in the paper. (“10-yr Yield” is the cumulative change in 10 year treasury yields. “Not Fed” is the cumulative changes outside of Fed meetings. “Fed” is cumulative changes during the 3 days around Fed meetings.)
One thing that bugs me here is that there is basically a linear downward trend here, and it is dangerous to attribute much power to such a relationship. Without a sharp change in trend, we can’t rule out some general downward trend that is affecting both. Here, I think the correlation might actually be spurious.
One factor might be short term risk. Hillenbrand acknowledges this.
Risk premium due to announcement exposure. Investors might require risk compensation for being exposed to news. It therefore seems possible that bond investors require compensation for being exposed to the information coming out of the Fed. This might explain why Treasury returns around FOMC meetings were positive – or equivalently why Treasury yields fell on these days.
Basically, the Fed meeting itself creates risk for bondholders, so they require a slightly higher yield to buy bonds before a meeting, but once the meeting occurs and investors know what the Fed action was, that uncertainty is reduced, and they don’t require a small premium for accepting it. He addresses why he thinks the Fed meeting risk isn’t important. I am not convinced. So, I decided to look at the data.
I added a third component. In this component, Fed risk rises slowly each day until the Fed meeting, when it reverses. So, the cumulative rate changes over time are net of this small short-term risk cycle.
This is purely mechanical. It should not have any effect on idiosyncratic information derived from Fed policy statements. If I set the risk component to 0.018% (In other words, during each Fed meeting, yields decline mechanically by 0.018% and then slowly rise by about 0.018% by the beginning of the next Fed meeting.), the cumulative rate changes look like Figure 5.
With this assumption, the cumulative rate changes outside of Fed meetings match actual rate changes very well. This doesn’t mean that Fed meetings are meaningless. There are a couple of distinct periods where significant persistent trends seem to correlate with Fed policy announcements. From early 2008 to the end of 2011, about 2% of the decline in the 10-year yield happened in days around Fed meetings. Then, from 2012 to 2014, much of that reversed.
The slope of each of the two main measures (“Fed” and “not Fed”) can be dismissed as little more than chart fitting. But, there are two points to consider here beyond the debate about whether there is a meeting risk effect and what scale it is.
When the slope is set to match the change in actual yields, the changes in yields that don’t occur around Fed meetings match them much better than the changes in yields that occur around Fed meetings. Both measures have some parallels with actual yield changes, but the strength of Fed meetings isn’t so obvious as it seems when its slope happens to line up with the actual yield slope.
Here, I have also included data up to the present, which is very helpful here because this period includes a sharp trend break. If the long-term matching slopes were economically important, then trend breaks should be shared. As you can see, essentially all of the increases in the 10-year yield since 2020 have occurred outside of Fed meetings. In a version of Figure 4, extended to today, the yield changes occurring around Fed meetings continues to trend down. In Figure 5, when the trend shifted upward, it was rate changes outside of Fed meetings that shifted with it.
This is especially clear if we ignore the question of what the meeting risk scale should be. In Figure 6, I use the original 3 measures (all yield changes, yield changes during Fed meetings, and yield changes outside of Fed meetings), and I detrend them, so that they all have zero slope during the period covered in the paper.
You could argue that the cumulative decline in long-term yields since the 1980s has come entirely from Fed policy announcements or you could argue that the recent spike in long-term yields has been driven by Fed policy announcements (in which case, you would need to argue that it doesn’t matter which days the rate hikes occurred on), but I think it would be hard to argue both. I would argue that neither statement is particularly strong.
Nearly 90% of quarterly changes in 10 year yields since 1994 have been due to changes that happened outside of Fed meetings. For a period of time after the 2008 financial crisis, most of the cumulative changes in long term yields happened during Fed meetings. But for most of the past 30 years, Fed meetings have not driven long-term rate changes.
The Fed and 10 Year Inflation Expectations vs. Real 10 Year Rates
Hillenbrand finds that the yield changes he attributes to information from Fed meetings are generally real yields rather than changes in inflation expectations. TIPS markets in recent years allow us to estimate inflation expectations vs. real yields.
Figure 7 shows changes in 10 year inflation expectations since 1997. These generally happen outside Fed meetings.
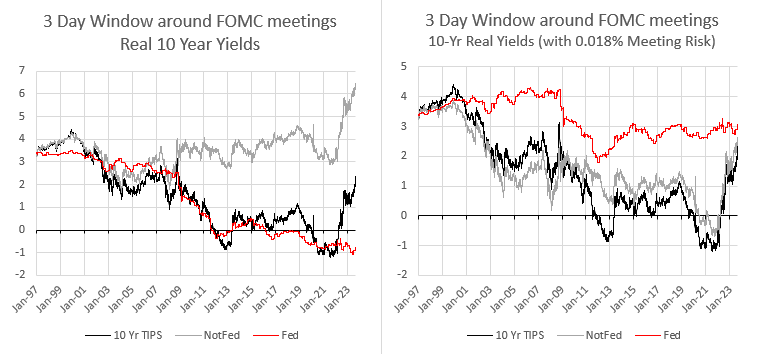
Figure 8 shows changes in real 10 year yields since 1997 that happened during Fed meetings and outside Fed meetings. The left panel shows the raw data. The right panel shows rate changes after accounting for a 0.018% meeting risk premium.
Here, again, you can see that many of the changes, and especially the changes during the recent rate run-up, happened outside Fed meetings, but there was a period from 2009 to 2011 where changes generally happened during Fed meetings.
Figure 9 shows yield changes on 5-year real yields. (This does not include a meeting risk adjustment.) Again, here, you can see the downward drift in yield changes around Fed meetings, which continues in the recent period. And, in the 5-year yields, changes from 2009 to 2011 mostly happened during Fed meetings, but otherwise were highly likely to happen outside Fed meetings.
The meeting risk premium that would remove the downward drift of yield changes during Fed meetings in 5-year yields is higher than it is in 10-year yields. My just-so story here is that changes in forward rates are largely related to changes in expectations outside of Fed policy statements. But, from 2009 to 2011, mid-term economic expectations and rate expectations mostly depended on how committed the Fed was to maintaining stimulus in the form of Quantitative Easing (large scale asset purchases while short term rates were near zero), to eventually raise the short term rate above zero.
I spent a good amount of effort back in the day, at my old blog, using a simple model where I measured Fed policy as the amount of time expected to elapse before the eventual rise from the zero lower bound. Back then, I found that the rate of the expected first rise in the short term target rate was generally moving ahead in time, so that we weren’t generally getting closer. According to this data, it appears that the disappointment of an ever-out-of-reach future rate hike generally was inferred from Fed policy statements rather than from other real shocks.
Conclusion
In conclusion, I remain resolved in the belief that the Fed generally follows forward rates rather than the other way around.


Excellent paper you've written here. Just wondering how much of the recent yield run up (and inflation) might be due to fiscal easing not much, if at all, offset monetarily by the Fed? If so, then the Fred's relative (to fiscal easing) inaction is a contributor to the run up, though perhaps not "the" driver. "The" driver would then be the fiscal authorities, but that is a political question!