
What Homes Are Missing, again?

I’ve sliced and diced the data a few different ways on this. On the video in the previous post, I used versions of the following 2 charts.
First, Figure 1, the trend of adults per home and adults per occupied home, since 1966.

Then, Figure 2, the difference between the adults per home and the 1966-2008 trend in adults per home, expressed as the number of missing homes.

It comes to about 15 million.
I thought it might be interesting to disaggregate that number into the various causes of the divergence. Figure 3 shows the different sources of reduced housing, stacked.
First, is vacancies. Initially, vacancies were high during the 2008 crisis, but then, over the course of 2 decades of underbuilding, they have declined. Currently, I would estimate that we are nearly 5 million vacant units short of a level of vacancies that would be associated with sustainably neutral rent inflation.
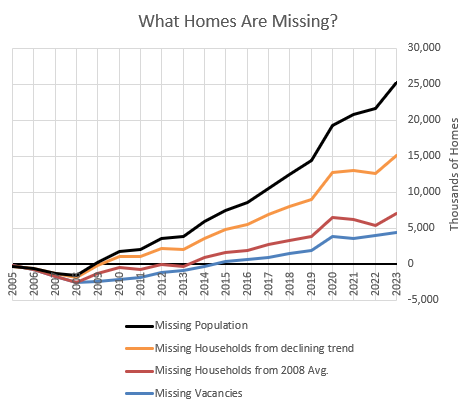
Second, the number of households it would take to get back to the adults/occupied home level before the crisis. That’s nearly 3 million additional homes.
Next, the number of adults per home required to get back to the trend line. For decades, adults per home has been declining slowly, and there is no reason to think it would have suddenly stopped in 2008. This is about 8 million homes.
The trend accounts for about half of the 15 million unit estimate from Figure 2.
Now, certainly, there is a lot of room for that estimate to be different. But, the starting point for that debate is 8 million houses, not zero houses.
Figure 4 shows some international comparisons of average household size (including children). The US and UK have flattened out. The US and UK have housing shortages. Japan, France, and Germany have continued to decline.

These trends clearly can’t be linear forever. Maybe a nonlinear trend would have led to 6 or 7 million additional households instead of 8 million.
My basic estimate might be a slight overstatement. It might not be quite 15 million, but I think if you try to argue that a natural change in trend pulls the shortage estimate below 10 million, you’re just not being serious.
Then, finally, I have added one additional category here that I didn’t include in the 15 million unit estimate. Population growth also slowed sharply after 2008.
This is a little trickier to get at. I don’t think population growth would have continued at the previous rate under any scenario, though population growth had been surprisingly stable for decades before 2008. Clearly, slowing population growth and smaller families are the international trend.
But, the housing shortage has definitely caused some delays or changes in childbearing rates. It has affected the demand for immigration. And, it has affected the willingness of Americans to accept immigrants.
Population growth unencumbered by the housing crisis wouldn’t have amounted to 10 million homes, but it seems likely that it would have amounted to a few million. That’s as detailed as I’m going to get here.
You can use your own intuition to decide where your estimates of these 4 factors fall. Hopefully, these figures help to think about the scale of those estimates.
Curious if you think there is a way to slice and dice the VRBO effect. Not thinking about the No Corporate House ownership, more just wondering how those types of units might be counted. Is it zero adults or one and if it is one, how is an owner of multiple houses counted?
Is the composition of the household also a factor here? You have more single heads of household than ever before. We've been sold since the post-war boom, the idea of a single-family house as the desired property to have and that more space is always better but I'm not sure it's led to the best outcomes.