


Households and Houses

I have previously walked through various estimates of the housing shortage. Depending on the approach, I come up with 10 to 20 million units.
In this post I’ll use a couple new visualizations to look at the problem from yet another slightly different angle.
This uses household counts from the Census Bureau’s Housing Vacancies and Homeownership survey. And annual estimates of completed site-built homes and shipped manufactured homes. The household survey is a bit noisy, but we can make do.
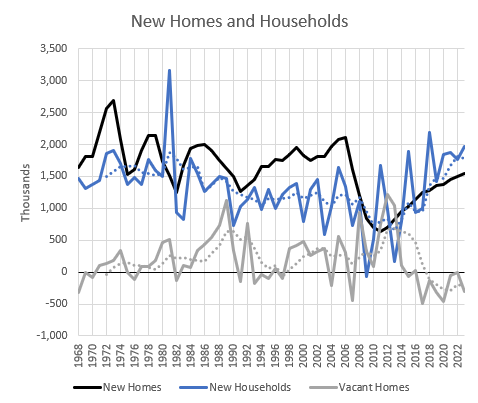
Figure 1 shows the annual growth in households (blue) and vacant (gray) homes and the number of new homes completed (black). Basically, the number of new homes has to slightly outnumber the number of new households, over time. Some of the extra units will be vacant. Some of them will replace old homes. From 1968 to 2007, the difference was generally about 460,000 more new homes each year than households. Since then - over a period now spanning 16 years - we have been short about 140,000 homes annually, relative to household formation. As you can see in Figure 1, we have managed this by harvesting vacancies. Vacancies are now about as low as they can get.
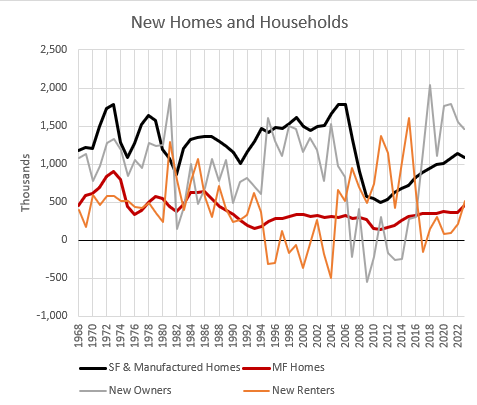
In Figure 2, I separate out new homes into apartments and single-family homes, and I separate out households into renters and owners. Generally, landlords prefer apartments and homeowners prefer single-family homes, though there is a small amount of overlap (condos and single-family rentals).
As in Figure 1, new homes needs to outnumber new households because of the need for some vacancies and replacements.
From 1968 to about 1994, the number of new homeowners was somewhat below the number of new single-family homes. The number of renters roughly increased at the same pace as new apartments. There are usually some additional vacant apartments each year, so some renters use the single-family market.
Apartments are routinely obstructed by municipalities. In a market driven by preferences, there would have been more apartments, and, probably, fewer renters in the single-family stock of homes. Or, maybe there would have been more renters and fewer homeowners.
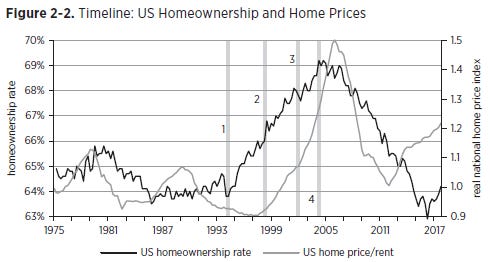
Then, though, from 1995 to 2004, there was an unusual increase in homeownership. A large reason for that is age demographics. Older households tend to be owners, and boomers were aging into the prime homeowner age groups. Some of it was from the outflow of households from the Closed Access cities (New York, LA, etc.) that block housing growth into other more affordable regions where homeownership is more attainable. Some of it was due to innovations in mortgage underwriting to serve households from previously marginalized populations.
Many readers will scoff at that last sentence. But the private subprime boom was from 2004 to 2007 when homeownership dropped sharply. The reckless mortgages weren’t associated with more homeownership. Also, as I pointed out in Shut Out, almost all the rise in homeownership happened when home prices were within historical norms.
Then the mortgage crackdown that came after the subprime boom abandoned the advances that had been made in underwriting in the 1990s.
I think an interesting facet here is that, all of the increase in construction in the 1990s and 2000s was in single-family homes. But in terms of matching households with units, single-family homes were barely keeping up with new homeowner households until 2005. In terms of matching households with units, apartments were the “excess” units.
But, since the financial crisis was prefaced with several years of collapsing growth of homeowner households, it was associated with a collapse in single-family home construction. Apartment construction continued strong through 2008 and then recovered quickly.
The period from 2005 to 2016 is interesting. The mortgage crackdown slammed the brakes on homeownership and on the construction of new single-family homes. There are about 15 million new homeowners missing from that period compared to the years before and after it. About 9 million additional renter households were formed. In a very broad estimate based on these household formation trends, this left a gap of about 6 million unserved households.
And, here, the universal municipal opposition to apartment building became binding.
This is the period that I describe as ripping off our proverbial housing band-aid. For decades, most cities had covered up their anti-apartment zoning codes with new single-family homes in the suburbs and exurbs.
When the mortgage crackdown caused single-family construction to collapse, it ripped the band-aid off. We suddenly needed millions of apartments, and collectively, municipalities’ obstruction of them capped national production at less than 500,000.
Those renters had to go somewhere, so institutions started buying single-family homes to manage as rentals. Of course, in Americans’ never-ending quest to ignore fundamental reality in order to blame scapegoats, most Americans have concocted a story where those institutional landlords are some sort of bully that is driving up home prices and rents.
Since 2016, the growth of homeowners has recovered. One way to think about this is that the mortgage crackdown basically was a one-time shock that excluded, maybe, 20 million households at any given time from homeownership, compared to previous 20th century norms. (Some of those excluded households are still living in the homes they purchased before the crackdown excluded them.) But, now that the shock has played out, the flow of new households into homeownership will return to a rate somewhere close to the previous rate.
The thing is, the mortgage crackdown had pushed the prices of entry-level single-family homes well below the cost of replacement, so for some time, the effect of this return to a growing number of new homeowners was to poach single-family homes back from the landlord market, to drive up existing home prices, and to force renters back into apartments and also to slow down household formation in general.
The institutional single-family landlord market shouldn’t exist, and it never existed before 2008 to any extent. And the reason is that funded households will always outbid institutional landlords for single-family homes.
Institutions would prefer to build apartments for the 15 million+ new households who must be renters. But they can’t. If zoning allowed it, apartment construction would be through the roof. But since it can’t be, the new rentals will be single-family homes.
So, going forward, the number of new apartments will rise as quickly as reforms allow them to. That will be much lower than the number of households Americans want to form. All the remaining additional renters will be served by new single-family rentals. Single family home construction will need to be much higher than the formation of new homeowner households in order to meet that demand.
Two-million units annually isn’t out of the question.
There are 2 ways to stop the new single-family rental boom. (1) Ban it and send this country further into a hellscape of permanently rising homelessness and regressive financial despair, or (2) make more apartments legal.
Great summary, thank you for posting. You've explored so many ideas in your stack, it's helpful to occasionally get a condensed recap and timeline like this.
Question for you:
You're describing the housing situation in the US generally, but in practice there isn't a single national market. New apartments built in the middle of Kansas are not fungible with new apartments built in LA.
I don't have data for this, but my intuition is that cities and towns in the south are already building houses and apartments at roughly the same rate that refugees from the closed access cities are giving up and moving south. If southern cities could ramp up housing production even more and drive costs down perhaps the rate of migration would accelerate, but by definition we can't solve the problem of *displacement* by building houses in other places.
So how do you think about the geographic distribution of the housing shortage and geographic elasticity of supply?