I was all set to do a post-election post on “The Housing Theory of Everything”. Inflation seems to be a motivating issue and inflation is all about regressive rent inflation.
The Big Story I have moved toward over time is that the mortgage crackdown in 2008, in the end, mostly resulted in a shortage of new housing that created excess rent inflation of 20% or more. That is an average of moderate rent inflation in richer neighborhoods where families still buy and build homes and 40% excess rent inflation where families are clamoring for units in the stagnant existing stock of homes.
The IRS has only published ZIP code level income data up through 2021. That story is in place through that time. Since then, the story has moderated, somewhat. Figure 1 shows excess rent inflation since 2015. For a while, the question has been: Is rent inflation reverting to a moderate mean? (Going flat in Figure 1) Or, is it reverting back to the rising trend? (Moving back to the trend line and continuing to rise)
These have been strange times. So, the story is a bit complicated, but also maybe a bit hopeful.
In the Erdmann Housing Tracker model, I use ZIP code income as the independent variable. But, I have to infer incomes since 2021. So, to keep it simple, in Figure 2, I show the trailing 1-year change in rents, in the cheapest ZIP code, the median ZIP code, and the most expensive ZIP code.
Rent is correlated with a number of things - local income, location, amenities, etc. - so the interpretation of these charts is not so simple.
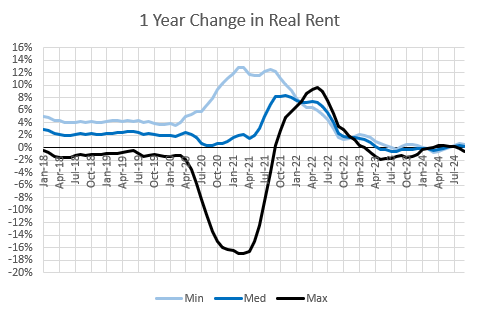
Some of these changes are just a reflection of broader inflation. So, in Figure 3, I show the real change in rents, adjusted for inflation, in the cheapest, median, and most expensive ZIP codes (among the 1,383 ZIP codes that I used, which have Zillow rent estimates for this time period).
There are several things to note here, and I think it is best to work through different phases.
Phase 1: Before March 2020. This is the classic post-2008 set up I described above. Housing supply has been so thoroughly constrained that the regressive displacement patterns that have been in place in New York, Los Angeles, Boston, and San Francisco (the Closed Access cities) for several decades are now in place everywhere.
The housing stock is so constrained, there is a constant bleeding of demand out into the existing stock of homes that must raise rents fast enough to make some families poorer if they stay in their existing homes. They have to be priced out of their homes in order for those homes to serve as new supply for others, in lieu of actual new homes.
Previously, this process only led to outmigration from the Closed Access cities into other places that were willing to build. Since we have spread the problem nationwide, regional migration cannot fully address the problem. The receiving cities have increasingly met the problem with their own rising rents rather than with new homes. Families have had to retract their housing consumption in any number of ways to make up for it. One of those, of course, unfortunately, are the increasing numbers of homeless residents in many cities. But, for every homeless person, there are countless others who have made compromises that aren’t so visible to us.
The reason the three measures moved dependably separately from each other before 2020 was because rent inflation in those conditions is highly negatively correlated with incomes.
Phase 2: April 2020 - May 2021. The difference between the cheapest and most expensive ZIP codes after Covid arrived wasn’t due to an acceleration of the issues in Phase 1. It was due to families moving away from dense urban areas because of Covid, new work-from-home possibilities, etc. This shows up in Figures 2 and 3 because the most expensive ZIP codes are in the dense urban areas. (But, dense urban cores don’t necessarily have high incomes. The correlation between incomes, density, and rents is complicated.)
Figure 4 shows the correlation between rent inflation and population density. More dense ZIP codes were actually already losing favor, somewhat, before 2020. But, then, there was a real exodus.
The exodus has reversed, slightly (Figure 4). Since 2022, density has been associated with moderate rent inflation. But so far it looks like much of the exodus will be permanent.
Note that, for the median ZIP code, rent inflation actually moderated during that time. But there was a huge divergence between cheap ZIP codes and expensive ZIP codes. Much of that was related to migration out of dense and expensive cities.
There is a lot going on there. Should we think of that as a loss of urban amenity value? Or, should we think of it as a technological substitution and real economic progress? Families used to put up with the negative externalities (crime, traffic, etc.) of cities in order to get the positive externalities. Now, they could get some of the positive externalities (e.g.. zoom meetings instead of conference room meetings) without the negative externalities (walking from the bedroom to the den instead of fighting traffic for 30 minutes).
There was surely a bit of both. Both factors would have led to lower urban rents. The question for economists would be, do those lower rents reflect lower value or higher consumer surplus (and thus real income growth)? (If this is confusing, consider this analogy. Spending on chemotherapy could decline because it isn’t working or because it did work. One outcome is poverty and one is riches. They both involve less spending.)
However, in a market that wasn’t universally and extremely supply constrained, the end result of that shift would only be to lower rents in the expensive urban ZIP codes. In the cheaper ZIP codes, the reaction would have been more supply. Since we broke our housing market, the reaction was rising rents in the formerly cheaper ZIP codes. And, that, unfortunately, clearly represents a loss of real incomes.
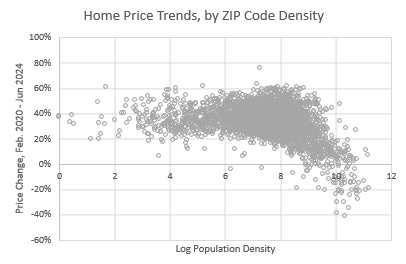
In Figure 5, (here using prices) you can see how much the decline in prices was related specifically to very dense parts of the most dense cities. Again, that could be because the downsides of density increased or because the upsides of density were now available elsewhere. In either case, the movement up or down of the least dense 80% of the market is a product of supply conditions, rather than a question of the value of density.
If we had been building 2 million units a year with 4 or 5 million additional vacancies in 2020, the light blue line in Figure 3 would have been relatively flat. We would have increased our utilization of the existing stock of homes and we would have gotten to work building more. Instead, rents went up. Land rents, specifically.
Phase 3: June 2021 - December 2022. This period, I think, was just associated with a moderate rise in the general demand for housing, famously due to our increased reliance on our homes during the Covid scare. You can see that this is different than the grinding compromises and cost-push poverty associated with the housing shortage before 2020.
There was just increased demand for housing in general. The cost of construction inputs increased, for example, which increased the cost of all homes. This is a different process than the process that pushes prices of older homes higher when there aren’t enough new ones.
In the Erdmann Housing Tracker data, you can see how this plays out within metropolitan areas. The cyclical rise of home prices in Austin during this time is an example of it.
Phase 4: January 2023 - present. Since 2022, rent inflation has not been as elevated as it had been before 2020 (as shown in Figure 1). I haven’t been sure that this is a permanent new regime, but increasingly it appears to be.
New housing construction is still capacity constrained, but we avoided a decline in housing production. And, it appears to be poised to grow again. This has had valuable consequences for American families. The grinding regressive rent inflation appears to have stopped.
Rent inflation is running pretty closely in line with general inflation (my other numbers show it still just a bit above, but not much). And rent in cheap ZIP codes is rising at about the same rate as expensive ZIP codes.
I think that, in real time, the “Housing Theory of Everything” isn’t driving current economic numbers. Rents are finally moderating. And, if construction continues to grow, rents might recede in a progressive way, where working class families get the bulk of the benefits.
These sentiments don’t change overnight. And, if rent in a ZIP code has stopped rising but is still elevated 40%, we shouldn’t even expect sentiment to improve that much. So, I think these pressures are still an important aspect of the apparent disconnect between economic sentiment and broader aggregate measures of the economy.
And, even if things are getting better, it will take a long time for that sentiment to change.
But the trends are tentatively fantastic news.
I also think there is good news because part of what has happened is that rents had to make a one-time jump in order to move into a new equilibrium where 20 million households are locked out of mortgage access. The market has to work for landlord buyers, who require a lower price/rent ratio (and, thus, higher rents for a home that costs x-dollars to build) than homeowners do.
We have hit that new equilibrium. Build-to-rent is about to take off. It will rid us of the regressive rent inflation. Maybe it can reverse it a bit. It would reverse a lot faster if we let those former mortgaged families back in the market.
In any case, even if the best that policymakers can do is keep their hands off the housing market, we might already have taken baby-steps into a new trend where tensions will not be as enflamed. Both the Harris campaign and the Trump campaign have been supportive of bills and rhetoric against landlord buyers. Any legislation that stops that market from developing will make things worse again.
Going forward, I suspect the politics will be like playing Dungeons and Dragons, and every week will be a roll of a 20-sided die, and we’ll just have to hope each week that it doesn’t come up as a “1”, where the Trump administration and Congressional Democrats find common cause in putting the final nail in our shared coffin with some sort of ban on institutional homebuying.


I appreciate that you're trying to strike an optimistic tone, given that we're looking at a minimum of four years of erratic governance at the Federal level. I'm also glad that you're keeping a close eye on the single family build-to-rent market because it might be a critical source of supply for the years to come. Every time I look at the FRED chart of multi-unit starts I feel a sense of frustration at what seems to be a production ceiling of 400,000 units a year. The complexity of planning and building large scale buildings seems to have created a market where production is capped by a market consensus that is probably a few hundred thousand units short of demand capacity. Thus, all demand shortfall has to be met by higher production in the single-family market, which in the most charitable scenario, is running at least 300,000 units short of annual demand capacity to make up for the Great Recession backlog.
I don't see single family build-to-rent making up that shortfall in this decade. Even if production in that niche expands considerably I wager it will never exceed 150,000 units a year, where it will be capped by a limit on cash capable investors.