
Podcast Interview with Peter Yoder

I had a great and thorough conversation with Peter Yoder covering many issues in housing. Peter has definitely done a lot of thoughtful reading on the topic and on my thesis. Many great questions, and long (and I hope edifying) answers.
We touched on many issues. One issue was on household formation. It’s one of many examples where seemingly definitive data can seem to tell different stories when you don’t know what you don’t know. And, I think it points to some interesting implications for where the US housing market goes in the next 20-30 years.
It’s astounding at this point in the crisis that there are still supply shortage truthers, but one of their favorite talking points is that the number of members in the average household is at all-time lows and that the average home is much larger than it was many decades ago. How can there be a shortage if there is apparently more square footage per person than ever before?
I have written about this a few times before. And, I have been recently using the V-shaped turn in adults per family household to quantify the scale of the post-2008 shock to household formation.
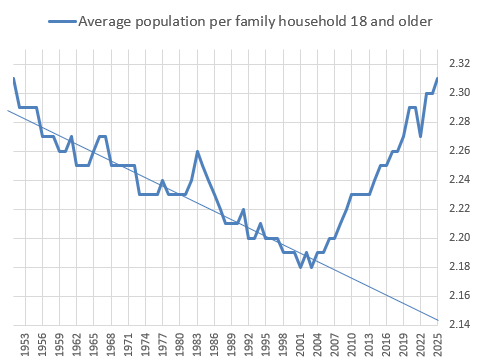
Figure 2 shows average household size for all households and for family households. We have more homes per capita than ever before, and turning that upside-down, that means there are fewer members in the average household. Family household (households with at least 2 people who are related to each other) size has been basically flat for 20 years (the blue line in Figure 2). The broader estimate of household size has continued to decline because the number of childless, unmarried adults has continued to rise as a percentage of households.
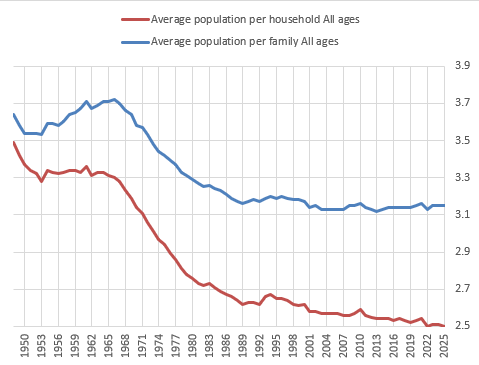
So, if the number of adults per family household has risen, and the average family household size has stayed the same, then that means that the decline in the number of children is almost exactly offsetting the rise in adult children living with their parents.
It might be useful to visualize that, so in Figure 3, I have aligned adults per family household and children per family household with the same scale on the y-axis to compare the changes.
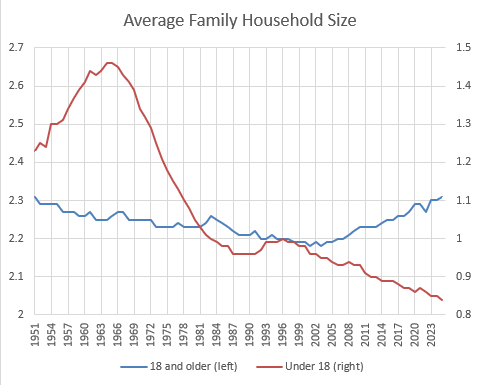
As I mentioned in the interview, 5 year-olds don’t form households, so in practice, these trends don’t cancel each other out. Those 14 million extra adults would have formed 10 million more households if homes were available. At the same time, families with 14 million fewer children would have moved into the same number of homes they otherwise would have, but we might have expected them to be smaller, on average.
Side point: Part of the decline in children per family household is due to declining fertility, but part of it is likely a baby boomer effect. The average includes a historically unusual number of empty-nesters.
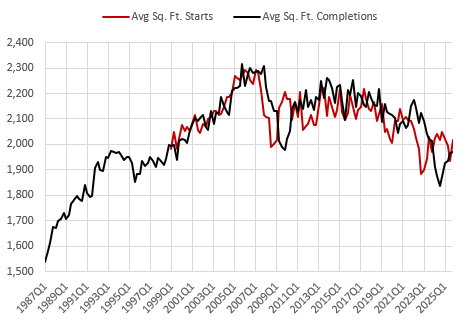
Anyway, in fact, new homes have been getting smaller. Apartments have been getting smaller since 2008. Single-family homes have been getting smaller since 2015. And, since the mortgage crackdown in 2008 collapsed single-family construction, but not apartment construction, a higher proportion of new homes since 2008 have been in the smaller, multi-family form.
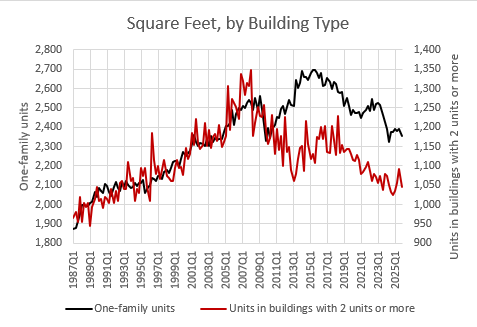
Taken as a whole, the average new home has been getting smaller since 2007, and is now back to mid-1990s sizes.
New homes are, likely, getting smaller both because families are compromising on other factors to counteract inflated land prices and because families are having fewer children. In any case, taking all of these trends in home sizes and household sizes into account, they are trends that reflect a housing shortage.
Average real per capita incomes are up about 25% since 2008 and average new home size is down about 25% 15%. (Sorry. Typo in original. The drop is more like 15%, not 25%.) Over that time, the average household size has declined by only 3% (from 2.56 to 2.50 members). Households that would have formed, aren’t forming. Households that do form are purchasing new homes that are shrinking in size much faster than households are shrinking in size.
It is perfectly understandable that a person would think homes per capita should be a definitive measure of whether there is a housing shortage, and certainly a definitive measure of whether it is at crisis levels.
There are some think-tankers who, for whatever reason, are motivated to mislead on this point, so they have spread talking points that compare the size of homes and households today with the size of homes and households in 1970. Since square feet per capita did rise substantially between 1965 and 1995, that comparison shows a tremendous rise in housing abundance, which is true about 1965 to 1995. And, it conveniently hides the sharp curtailment of those trends after 1995, and especially after 2007.
“Why are young adults so mad? Their parents had it a lot better than their grandparents did.” Asking that question without knowing you’re asking that question is a recipe for confusion.
This is also related to the question of how markets will settle out if we allow the new rental market to grow to lower the inflated value of urban land across the country, but we don’t return mortgage access standards to the late 20th century norms. If we end up with 15 million additional homes and a homeownership rate at about 60% instead of 67%, the rent on a home at any given price will be higher than it was before 2008, because owner-occupiers are the price setters, and there are fewer of them now. The prices will settle at a level that translates to the cost to build a new home on a lot in the exurbs with minimal land cost. When they do, the rent on that house will be higher than it would have been under looser lending norms when families bid the prices of homes with a given rental value higher.
Will high rents keep some of those adult children at home, even after inflated land values are corrected away? I don’t think so. Families make huge changes in real consumption of housing to keep nominal spending on housing stable. That’s why there has been a 50% 40% divergence between new home size and real incomes. That’s why the Case-Shiller index was flat for a century. And, it’s why a Case-Shiller index that has leapt out of that century long range is a sign of crisis, and not just a small problem.
By the time we manage to build enough homes for those households to form, our real incomes will be another 25% higher than they are today. If the average new home size would have followed real income growth, the average would be 2,900 square feet today rather than 2,000. And by the time all those households would form, it would have risen to 3,500 square feet.
If we don’t fix mortgage access, I think those 15 million+ units will be built, and they will continue to be much smaller per dollar of income than they otherwise would have been. They might still be larger than the average new home is today, since incomes are rising. And, there is plenty of room there for the new households to make significant changes in their real consumption of housing to form new households in reasonable new units that bring their spending back to normal levels.
If we fix mortgage access, household formation will rise, and the average size of new units will correct back up toward the pre-2008 trend.
If we also fix Closed-Access zoning, there will be a number of cross currents. The new units in the Closed Access cities might be smaller because the units that aren’t built as a result of zoning tend to be apartments. On the other hand, they will be larger as land rents are corrected in the Closed Access cities, and families can afford larger units within their budget constraints. But, on the other hand, that will slow or reverse the current migration pattern out of the Closed Access cities (where square feet per capita is lower) and into the Contagion markets (where square feet per capita is higher). That might net out to declining square feet per capita, nationally.
If YIMBY reforms are effective across the country, then average home size will decline because it will finally be legal again for American households to choose locational amenities over the value of space and size.
In any case, there will be 15+ million homes to build. Eventually, the baseline growth path those 15+ million homes will be built on will slow as lower fertility and aging baby boomers affect growth, but we are years away from those effects being anywhere close to the scale of the shortage.
Think of it this way. The pre-2008 baseline construction trend to meet cyclically neutral demand for household formation was probably about 2 million completed homes, annually. We are now more than 15 million units short of that (which probably amounts to about 10 million occupied units and 5 million vacant units, to get back to normal conditions). The decline in fertility might mean that the new baseline for household formation is 1.5 million units annually, above which we need to overshoot until the overshoot adds up to 15 million additional units.
That doesn’t matter much at a point where we are several years of capacity growth away from even building 2 million units a year. The shortage is a today problem and residential investment today motivated by that shortage isn’t particularly sensitive to the future trend in household formation or immigration. In the 20th century, household formation didn’t cause rent and price trends to change. It caused building trends to change. If you’re building a neighborhood today, your return on investment is not sensitive to the number of units that will be constructed in 2045.
Really enjoyed the conversation, Kevin. I left with more questions than I started with which means it was a good one.