
Follow Up to Random Thoughts

I should have added one more chart to the last post. This will be one of my occasional posts where I do some back-of-the-envelope estimates of how many homes we need in order to eliminate inflated land rents caused by scarcity.
Missing Households
Figure 1 is the chart. This is average household size for non-families - unmarried adults with no children.
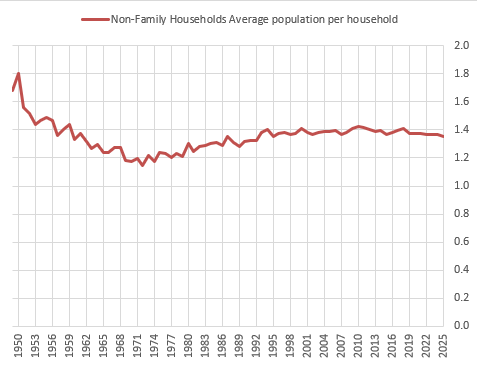
It actually rose from the 1970s to the mid-1990s, and has been level since then.
Looking at the trends in the different types of households lends itself to a new back-of-the-envelope estimate of the size of the shortage.
First, before we discuss household size, vacancies declined sharply from 2010 to 2023, and are now basically at a functional bottom - just over 10% of the housing stock. I don’t think it can go any lower. Before Covid, completions amounted to about 0.8% or 0.9% of the housing stock each year, and we were occupying a bit more than 0.3% of the housing stock each year that had previously been vacant. The vacancy rate has flattened out. We have recently been adding about 1% to the stock of homes each year. So production + more occupancy has gone from about 1.2% annual growth to 1.0% annual growth in spite of higher completions. So, possibly the number of homes required to level out rent inflation has declined from, say 1.5% of the stock of existing homes to 1.2%. But, since we’re out of vacancies, functionally, the number of completed new homes has to rise to a higher level to do that, relative to the pre-Covid period. (Of course, temporarily, population growth might pause for a year or two during the Trump chaos, but I’m thinking here more about the more persistent trend.)
Figure 2 shows the pre-2008 trend in adults per family and the current level.
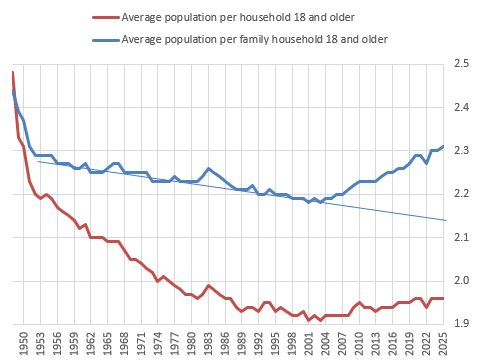
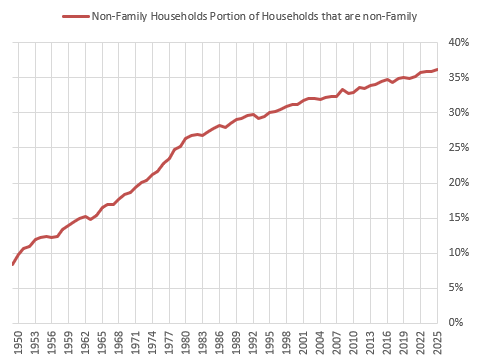
You might wonder why the number of adults per household has continued to diverge from the number of adults per family, since the number of adults per non-family household has been level for decades. That is because, as shown in Figure 3, the number of non-family households has continued to become a larger portion of all households pretty linearly. Up from 26% in 1980 to 36% today. And non-family households tend to be smaller.
This also affects the number of children reported per household. The number of children per household has declined by about 25%, but among family households, it has only declined about 16%. So, about 2/3 of the decline in children per household is from declining fertility and about 1/3 of it is from the decline in family formation.
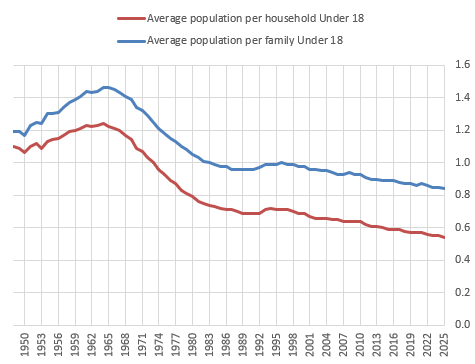
Much of the decline in family formation is cultural, but surely some of it is exacerbated by the housing shortage.
Anyway, we’ve got:
5 million unit shortage of vacancies
5 million units to get adults per family back to 2007 levels and 7 million units to get back to the trendline.
7 million units to get adults per non-family household back to 1970s levels.
Changes in marriage and fertility would have mixed effects on housing demand.
So, the minimum number here is 5 million vacancies and 5 million households to get back to pre-2008 adults per house levels. Those are changes that clearly are attributable to the mortgage crackdown and the subsequent decline in housing construction. So, the baseline shortage is 10 million units.
If the supply-neutral long-term trend in adults per family would have been persistent, then it will take an additional 2 million units to meet pent up household formation demand.
Surely some portion of the rise in adults per non-family household is due to Closed Access regional housing shortages. I’d say the shortage has 2 distinct phases (which is the 3rd and 4th era described in the previous post). Pre-2008 the shortage was regional, so, for the most part, households formed and new homes were built somewhere. They just required painful economic conditions in the Closed Access cities and perennial displacement from those cities in order for markets to settle.
Completions of new homes declined after the 1970s. The rate of new construction from World War II to the 1970s was unsustainably high. That was associated with a decline in adults per non-family household in Figure 1 and the sharp increase in non-family households in Figure 3.
The subsequent rise in adults per non-family household in Figure 1 aligns with the period of time when zoning became binding in the Closed Access cities, and the construction in the rest of the country had to rise to make up for it.
In the process of dealing with those regional shortages, in addition to displacement, families coped by compromising down into worse units, taking on roommates, etc. So, some portion of that increase in adults per non-family household was certainly associated with those compromises.
If I am wrong about that, that puts the shortage at 10 to 12 million units. If all of it could be attributed to regional shortages, that puts the shortage at 17 to 19 million. I think 12 to 15 million is a reasonable guess. But, it will take effective YIMBY reforms in the Closed Access cities to achieve the high end of that. If that doesn’t happen, then 10 to 12 million units will return the rest of the country to a normal condition and high earners in the Closed Access cities will continue to greatly under-consume housing in order to remain in housing-scarce locations.
Missing Residential Investment
In the previous post, I also compared real consumption of housing to real consumption of non-housing expenditures. Figure 5 is another way of looking at that. The red line is per capita real housing expenditures - how big, nice, and well-located our homes are. It followed a linear pattern during that 1970s to 2008 period. Benchmarking to that line is a conservative benchmark because there were already regional shortages then. That led to less real housing consumption in the Closed Access cities - smaller units even where household size remained the same and, likely, some increase in adults per non-family household, as mentioned above.
The real value of current homes, per capita, is about 13% below that linear trend, which is just under 20 million units, or, in terms of investment, that’s about 13 years’ worth of additional residential investment at the current pace - about $7 trillion of investment. Current annual residential investment in new permanent site homes is about $560 billion.
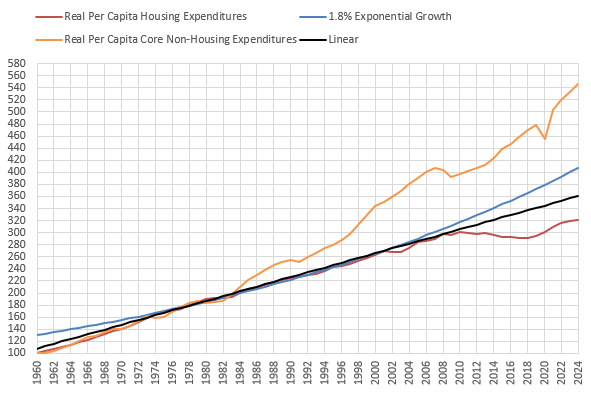
But, that’s conservative because I think the growth really should be exponential, and it only looks linear because housing has been growing exponentially at a declining pace (because of supply obstructions). The blue line shows per capital real spending on housing at a 1.8% annual clip. You can see that the growth of real per capita housing expenditures before the 1970s was much faster than that. But, from the 1970s to 2000, it followed that trajectory pretty closely before falling off sharply. That’s 26% above current real consumption, or about 40 million units.
Now, I definitely don’t think we need 40 million units. I think you could say that we are consuming less housing than we would if there weren’t arbitrary supply constraints, equivalent to something like 40 million units. But, a lot of the missing residential investment would have been 40 year-old financial traders in Brooklyn living in 2,000 square foot condos instead of 800 square foot apartments. Some of it surely would be software engineers in San Francisco living in their own 1,500 square foot condo instead of sharing a 2,000 square foot home with 2 other software engineers.
It probably sounds crazy because we are several generations into accepting the very poor housing conditions of the richest cities in the world as if they are a state of nature. They are not. They are an extreme aberration that would normalize if it was legal for them to normalize. I’m not saying that the average living space in Brooklyn will ever be as expansive as a suburban house in Houston. Not even close. But the scale of the current gap between those two wasn’t carved in stone on Mount Sanai. There is a lot of catch-up to do even taking into account the natural sources of higher housing costs in dense cities and the smaller size of units there even after reforms allowed for market corrections in the quantity of housing.
Finally, the orange line in Figure 5 is the growth of per capita real non-housing expenditures. Benchmarking to that would be too high. First, when there isn’t a housing shortage, as households become richer over time, they reliably and systematically tend to increase their consumption of housing, but at not quite a 1:1 pace. The average growth of non-housing expenditures since 1970 has averaged about 2.6%. Growth in actual housing consumption has averaged about 1.5%. And, my exponential growth benchmark, in blue, is set to 1.8%.
The exponential path is pretty conservative compared to the growth in other expenditures. But, also, because housing has been in a shortage condition, families have been substituting away from housing and into other forms of consumption where conditions are more favorable - putting larger televisions in smaller rooms, as it were. So, while I don’t know the scale, it is likely that if consumption of housing had not been so obstructed, and housing growth had been higher, non-housing expenditures would have been lower. Part of the gap, in other words, is downstream of the housing shortage, which means that the amount of housing it would take to get to a more culturally neutral level is less than the gap between housing and non-housing expenditures would suggest.
The 1.8% rate seems reasonable to me - even conservative. Don’t forget, before zoning and lending became binding, real housing expenditures and non-housing expenditures had reliably risen at the same rate as other real expenditures for many decades. The 1.8% growth rate assumes that Closed Access zoning had no negative impact on consumption of housing from 1970 to 2000.
Really solid breakdown of the mulitple ways to quantify the shortage. The distinction between the regional phase pre-2008 and the national phase after is crucial. I've been seeing that non-family household compression playing out in real estate data for years. The 12-15 million estimate feels rigth when you factor in the vacancy declines since 2010. YIMBY reforms in closed-access cities would be a game-changer.