
Ignoring Bad Real Estate Analysis for Fun and Profit, A Series: Part 2 Inventory
For Subscribers

In Part 1, I covered mortgage rates. Here, I will discuss inventory of homes for sale.
This is a 3 part series which contains important considerations for analyzing real estate markets that you won’t see anywhere else.
Part 1 was about interest rates.
In the previous post, I referenced a twitter thread by analyst Eric Basmajian. I will continue that here. Again, I am using his thread as a reference mostly because it is a concise collection of some common points of view; not because he is making any sort of unusual mistakes.
Further in his thread, he writes:
The best measure of US housing inventory takes into account both supply and demand and is called the months supply – in other words, how many months of inventory are available for the current pace of sales volume?
Months of supply is fraught with problems.
Basmajian shares this chart. Most of the time, inventory in existing homes and new homes are similar and give a similar signal. Most of the time, the signal it gives is that there was an unexpected decline in sales, and inventory rises, or vice versa. We can already tell that by looking at sales data.

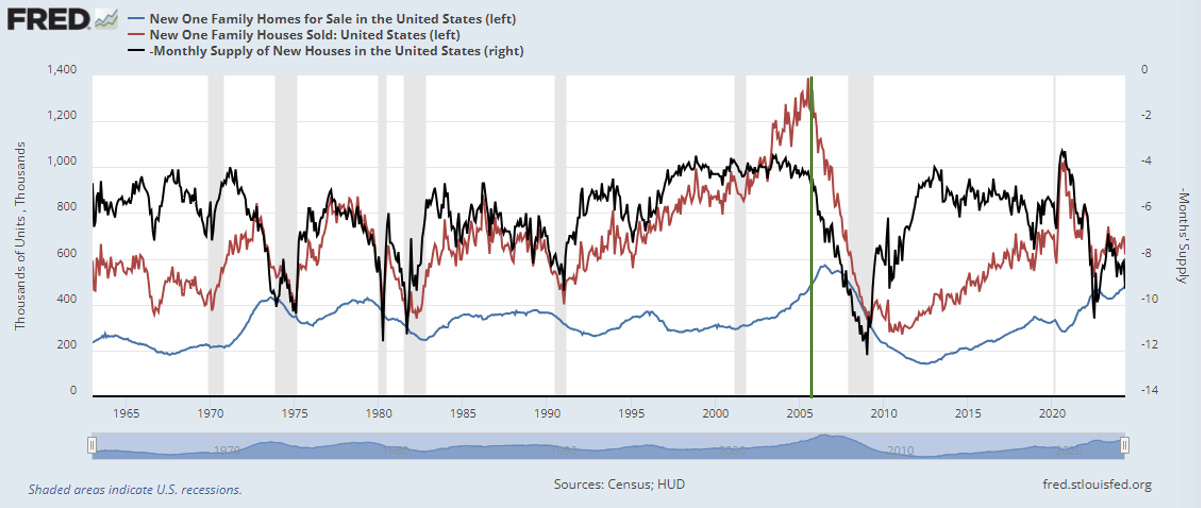
In Figure 2, I compare months of new home inventory (inverted) to its 2 components - home sales and home for sale. I marked the point where sales started to collapse in 2005. I inverted the inventory number because home sales is the denominator, and home sales dominates its trends.
You can see that after 2005, and in fact in every case where months of inventory rises (except since 2021), moves above the 4 to 6 month norm are purely driven by dropping sales, not by rising inventory. And, in fact, very soon after sales peak, inventory also peaks and starts to decline.
So, months of inventory doesn’t, in practice, “take into account both supply and demand”. When it is at its peak, it is high in spite of low inventory. (And, it is further confusing to treat inventory as “supply”.)
Where months of inventory is treated as a proxy for supply, this leads to a bias in both forecasting and public policy choices that a lack of demand is actually an excess of supply. It implies that construction needs to or will slow down to lessen the supply. But, often the proper expectation and policy choice is that sales will or should rise. In every case historically where months of supply was high and the trend reversed down back to normal, it was a quick recovery in sales that did it.
In every case, that is, except 2008, which I will get into below.
I see a lot of market analysis that treats high months of supply as a bearish signal. High supply is taken to mean that construction will have to decline or builders will lose pricing power. That is confused. But it happened in 2008, so it is understandable that others will volunteer for the confusion.
There is some information in the months of supply figure for new homes that can point to price trends. Figure 3 compares monthly supply of new homes (again, inverted) with the one-year change in new home prices. At the occasional points in time where new home prices have declined, supply of new homes does seem to serve as a useful confirmation of the balance between the shock in demand and builders’ retraction of new construction. When months of supply has reached 7 or 8 months, prices have tended to drop. And when months of supply has returned back to 4 or 5 months, prices have tended to stabilize.

Months of supply was probably a useful tool for confirming the bottom in home prices in 2012.
Frequently, existing inventory and new inventory are treated as competitive elements. If there are a lot of existing homes for sale, there is more “supply”, and so analysts and builders will say that new home builders have to offer concessions and lower prices to get sales, because buyers have more options. I think this is another case of overinterpreting some spurious correlations.
I think cross-sectional data can help here. AEI produces interesting updates on housing data. Figure 4 is their measure of months of supply, by price tier.
It would be interesting to see this chart extended to before the Great Recession. Are these cross-sectional differences long-term patterns, or are they the product of mortgage suppression since 2008?

AEI’s commentary interprets low inventory as being a “seller’s market” and high inventory as being a “buyer’s market”. And, I think, in this chart, we can see how this measure reflects two orthogonal factors, and that combining them can create confusion.
The price trend for each tier in Figure 4, over time, matches the “sellers vs. buyers market” intuition. When demand unexpectedly rises, the number of homes remaining for sale declines.
But, cross-sectionally, it doesn’t. Low tier homes don’t have lower inventory because the low tier market is strong. They have lower inventory because the market is strangled. After 2008, millions of homeowners in low tier housing were stuck. They couldn’t qualify for new mortgages, so they couldn’t trade up or down. For years, many of them were underwater because prices had declined so deeply.
It appears to be a sellers’ market because low tier homes have been appreciating more than high-tier homes. But, they were appreciating from deeply discounted levels. This wasn’t a “sellers’ market”. It was a long recovery from a “buyers’ market” after most of the buyers were obstructed.
As Figure 5 shows, AEI benchmarks their price indexes to 2012. This is deeply flawed. AEI leans heavily on interest rates and inventory, so by their estimation low tier homes are 12 years into an overstimulated price cycle.

Is this useful for analyzing the housing market or housing construction? How has this 12 year long “sellers’ market” in low tier homes affected homebuilder revenues?
Low-tier home prices have been rising because rents have been rising on low-tier homes. Rents have been rising because we largely stopped building low tier homes after 2008. We stopped building low tier homes because they were too cheap. Finally, low tier homes have gotten expensive enough to induce new construction. It will have to be sold to institutional landlords because most low tier tenants are still locked out of mortgage markets.
AEI gives the impression that they are unaware of the asymmetry in rent inflation, which might the most pressing social issue of our generation. AEI understands problems created by the urban land use regulations. And they maintain an impressive database on housing markets. These measures - interest rates and existing home inventory - are powerfully confusing enough to leave them lost in the woods in spite of that deep knowledge base and understanding.
Here is another slide from their June 2024 market report. Almost every word on this slide is wrong. Embarrassingly wrong. So wrong in practically every conceivable way that I don’t even know what EHT posts to link to about it. Every post I write, unintentionally, is a response to this slide because the slide is so thoroughly wrongheaded that simply trying to do any reasonable analysis of the housing market would be bound to challenge something on it.
During this period where homebuilders largely exited low tier homes and where they are finally building them again, they are rentals, AEI can only see loose lending and low rates.

EHT readers understand that urban supply constraints create the excess costs in low tier housing. That creates the widening gulf between low tier and high tier. A one time permanent credit shock in 2008 temporarily interrupted it. Because of months of supply data and a focus on interest rates, AEI won’t be able to engage with that. In housing, so much comes down to the things we know that just ain’t so.
There is no green text box in Figure 6 for the years 2007-2011. The period when millions of American households, including millions who had previously been eligible homeowners for years or decades, were permanently locked out of mortgage access is simply labelled “Buyer’s market” with no explanation.
Here’s footage of the AEI offices when someone tried to type “tightened credit” on their keyboard.

It’s odd that they have such a focus on government mandates for loose lending standards since they cite models that show deep, permanent tightening after 2008, and their own model shows post-2008 lending standards that have never been as loose as any time from 1994 to 2008.
There are labels on Figure 6 suggesting that lending was loose in the 1990s and it was a “predominantly sellers market”, but the price trends were relatively benign.

And, its a shame, because AEI is a strong ally for supply-side reforms that would make housing more affordable. They instead support more constraints on lending, which have caused more damage than urban land use regulations ever dreamed of. AEI doesn’t just miss this important issue. They seem to sincerely believe that the low months of supply of low tier homes in Figure 4 is due to free-flowing cheap credit for the residents of those homes. Figure 6 is actually a picture of the devastating costs of constrained supply, and AEI, on net, seems to be in opposition to itself.
If they weren’t clouded by interest rates and months of supply, I wonder if they could find some clarity of purpose.
The Fed
The inventory worm infected the Fed brain too.
Here is Jeffrey Lacker, the President of the Richmond Fed, at an FOMC meeting in December 2010. Read this paragraph, keeping in mind that the FOMC’s one job is to manage aggregate demand and, as shown in Figure 2, the inventory of homes for sale has historically been reversed by rising demand:
The outlook for residential investment still looks bleak to me. The Tealbook quite notably has slashed its forecast for housing starts in light of the large inventory overhang, and I think they have a more realistic path now. It must have been difficult to keep econometrically based forecasts from returning to recovery patterns much more like history, and I think estimating the magnitude of overhang relative to some sort of desirable stock of housing is inherently difficult. So I think they have a more realistic forecast right now.
In every single recovery before 2008, large inventory overhangs were reversed by stimulating sharply rising housing starts.
I have written about how Bernanke still claimed in 2011 that employment and GDP growth was still lagging because there was a glut of housing, and how ridiculous that claim is when you look at the actual supply of housing. That sentiment had to come from reasoning from inventory levels and treating them as a measure of supply in lieu of every direct measure of the consumption and construction of homes.
Here’s Bernanke at the January 2011 FOMC meeting.
There are still some questions about the strength of the supports for consumer spending, for example, employment, income, and wealth. In particular, the inventory of unsold homes, high rates of foreclosures, and tight credit continue to push down house prices, hurting household wealth as well as bank balance sheets, and unemployment seems likely to come down only very slowly.
Here is David Wilcox, a staff economist, at the April 2011 meeting, explicitly making the *existing home inventory competes with new home inventory* argument in order to lower the Fed estimates of economic recovery instead of stimulating more demand for home buying.
Although the inventory of unsold new homes is historically low, the tidal wave of other properties becoming available for sale is large and looks unlikely to subside materially any time soon. A remarkable fact is that roughly half of all sales of single-family homes recently have involved distressed properties—that is, homes that were either in possession of the lender or involved in a short sale. Banks and others disposing of these properties appear willing to take relatively steep price discounts in return for being rid of them. Although these distressed properties are not perfect substitutes. . .for newly built homes, they are substitutes nonetheless, and their presence in the marketplace appears to be putting substantial downward pressure on the prices of and demand for new homes. We responded to the intermeeting news by flattening out considerably the trajectory of our single-family-starts forecast. By the end of 2012, single-family starts in our current forecast are no higher than they were in the third quarter of 2008, long after the collapse of the sector was well in train.
Foreclosures are supply? And, since they are, and since banks are willing to take big discounts to unload them, the solution is to stop building new homes rather than support a housing market that no longer needs discounts? Good God.
It is remarkable that half of all sales were foreclosures or short sales. What would that ratio be if the number of normal sales or sales of new homes, say, doubled or tripled to get back to near normal levels?
Also, this is a good example of mistaking micro for macro. For a family out shopping for a home, a distressed sale is a substitute for a new home. For the macroeconomy it absolutely is not. Not at all.
Let’s have a thought experiment. Let’s say we’re in the middle of a famine, and the fields are half harvested. Every family has half the grain they need to make it through winter. Each bag is a perfect substitute for all the others. And they are also perfect substitutes for the unharvested grain, once it is harvested. If every family trades their half bag of grain with their neighbors, is that a substitute - in the macro-sense - for harvesting the rest of the fields? And, what does it say of monetary policy if the half-bags of grain are trading at a discount?
This is all reminiscent of some of the worst errors of the Great Depression where harvests were burned up to raise the price of food.
Here’s Boston Fed President Eric Rosengren in June 2011.
Our housing policies have been unsuccessful. Housing prices are unlikely to rise as long as there’s a large overhang of vacant and foreclosed homes. We need policies that return people to sustainable housing situations but quickly remove the inventory of unsold homes. Housing is one of the sources of serially correlated errors in the forecast, and our research suggests those errors explain a significant fraction of recent forecast errors, a greater fraction than can be explained by housing’s share in GDP or its obvious connection to household durable goods purchases.
Finally, here is FOMC member Elizabeth Duke at the January 2012 meeting. Morale had finally improved, so the beatings could stop.
Single-family starts have increased for the last few months. Existing single-family sales are picking up. More important, inventory has adjusted to the low level of sales. Inventory of new homes has been in the six-month range for most of 2011, as builders can’t or won’t build ahead of sales much more than that, and the inventory of unsold homes from failed construction projects that has come through bank REO is dwindling. Now, for the first time, the inventory of existing homes is down to six months, which is the level that I used in my years as a lender to indicate a market in balance, even at a very low level. Within the existing home sales and inventory numbers are still a high percentage of REO sales and investor purchases, so the level of normal homeowner-to-homeowner activity is quite low. I take it as a sign of stability and believe that more-balanced inventory will work to stabilize prices in the coming months.
Actually writing this out, it’s occurring to me, in a way that I hadn’t fully thought through before, that the narrative about how the housing market was soft for years after 2008 because of all the foreclosed properties hitting the market is fallacious. How exactly do foreclosures change the number of homes per capita, for instance? The solution to the number of foreclosures and the downward pressure on prices from foreclosures was to stimulate. This was 2011!
There are ways in which the “housing glut” myth screwed us up that even I am still coming to grips with. I touched on this in “Building from the Ground Up”, but I hadn’t thought it through when that book was finished. It probably deserved more emphasis.
I think there’s a Lucas Critique issue here too. Was months of inventory a good indicator of the bottom in home prices because it measures something important? Or was it a good indicator of the bottom because the Fed was satisfied with stagnation as long as it was elevated?
In the Fed’s defense, there may have been little they could have done to spur more homebuying under the new lending regulations. Millions of families just weren’t allowed to be buyers any more. But, the Fed could have been more helpful.
In fact, they could have stimulated rising new home sales by late 2007 when months of inventory was first elevated. That is what Ed Leamer’s paper told them to do, even if Leamer couldn’t bring himself to say it. If they had, maybe the moral panic about mortgage access would never have happened.
They weren’t more helpful, largely because they thought low interest rates were a sign of stimulus and that months of inventory was a proxy for housing supply.
This is your monetary policy. This is your monetary policy on interest rates and months of supply.

Conclusion
Months of supply is a demand indicator masquerading as a supply indicator.
Low months of existing home supply can signal strangled activity or hot markets. It can and has created confusion which at times has led to devastating results.
Lock those data variables up (interest rates and months of supply) and throw away the key before they kill again.
Months of new supply includes homes in various stages of completion. They need to be addressed carefully. The current context in American housing markets is unique, and this is an especially easy time to be confused by them. I will address that in the 3rd and final post.
See Part 3.