In the previous post, I noted how comparing housing growth to population growth doesn’t tell us anything about housing supply constraints, but understanding why it doesn’t tell us anything can help to understand why we have a housing supply problem.
In this post, I’m going to poke around the data a little more to underscore those points.
In the following charts, I will compare the US measure to four cities that should represent the extremes of the American housing market. Las Vegas (fastest growing), Houston (most housing friendly), Los Angeles (least housing friendly), and Detroit (slowest growing).
Figure 1 compares population growth. Las Vegas grew like crazy before the Great Recession. In addition to being lower since then, the variance of population growth between metro areas is much lower now.
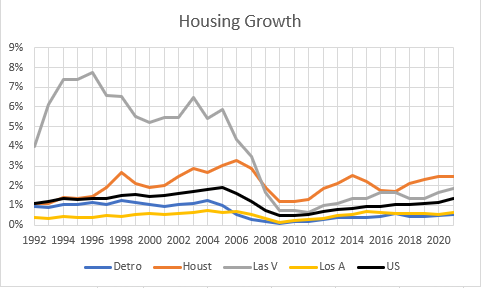
Figure 2 is housing growth. (I have basically just divided population by the average US household size of 2.6 to get the baseline housing stock estimate for each metro. It’s not perfect, but close enough for my purposes here. Most metros have within a couple tenths of a point of the US average household size.)
The post-Great Recession shift is the same as with population. Less housing production and much less variance in housing production between cities.
Here is the measure from Figure 1 minus the measure from Figure 2. Housing growth minus population growth.
Cross-sectionally, the slowest growing metro registers higher than the fastest growing metro (Detroit and Las Vegas). (Much of this is because some new building replaces old units, and metros with very slow or negative growth tend to have parts of the city with abandoned homes, so as population growth slows, the new housing minus population growth gap widens.) The path of housing growth minus population growth of the most housing friendly metro tracks with the most housing unfriendly metro (Houston and LA).
Over time, there are cyclical ups and downs where every city tends to track the national trend. Was supply loosest in Los Angeles from 2004 to 2007 or since 2016? These are the periods with the most displacement and outmigration from LA and from other housing deprived cities.
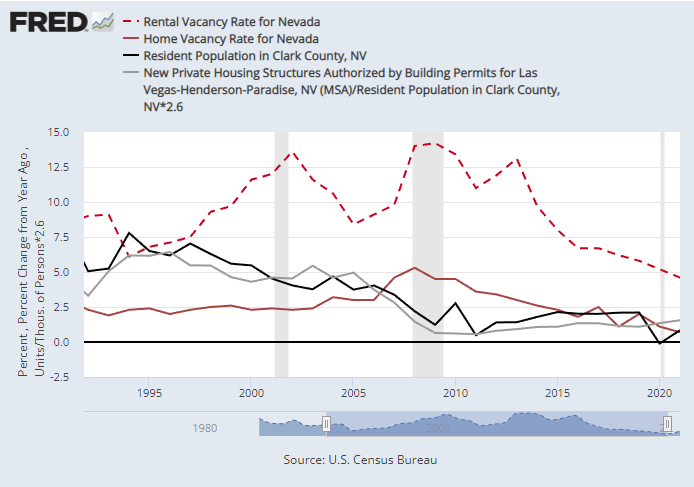
How about Las Vegas? (The source of population growth on the Fred graph in Figure 4 is different than the source for the other charts, so there are minor differences. And it uses Nevada vacancy rates, which track closely with Las Vegas.) Both housing growth and population growth have been declining in Las Vegas since the 1990s. One might be tempted to see the spikes in homes/population from 2002 to 2005 and treat this as evidence of the oft stated declaration that thousands of homes were built in places that had little use for them.
It is possible, even likely, that there was some housing activity in Las Vegas during that time related to speculative trading or building. But, the deviations of housing growth are not particularly large relative to the scale of growth. Also, home building never really increased in Las Vegas during the 2000s boom period. But population growth trended down.
The net results is that from 2000 to 2005, cumulatively, relative to the US, Las Vegas housing-minus-population grew by about 3%. In a city growing by 5% or more annually, that isn’t much inventory in terms of “months of supply”. And, in fact, rental vacancy rates declined substantially in Las Vegas from 2000 to 2005 while vacancy of owned units was relatively stable.
The rise in vacancy rates in Las Vegas lags the peak in construction activity significantly. By 2008, when both owned and rented vacancy rates had spiked, the rate of new construction had been steeply declining for 3 years. But so did population growth. The scale of the decline in construction activity is especially striking when seen in contrast to other cities and the country as a whole, in Figure 2.
Population growth in Las Vegas has remained under 2% since the crisis - less than half its normal rate for years before that. In 2008, there weren’t too many homes for a city growing at 4% to 7% annually. Vegas’ problem was that its growth rate went from 4%-7% down to 0%-2% in the blink of an eye. And, in fact, the decline in housing production came first!
In Figure 3 you can see that even by 2006, the housing minus population trend in Las Vegas was ahead of the national trend in its decline - 2 years before the Great Recession. What if the Great Recession happened because we didn’t have enough homes? What if the Great Recession and the decade of stagnation that followed happened because we cut off the top of the housing cycle in every city as the result of a moral panic?
And, I suppose the housing growth minus population growth measure does convey this point, since for most of a decade since the Great Recession, US housing growth rates were at or below population growth rates, especially in housing friendly cities like Las Vegas and Houston.
Though, again, I would not encourage trying to glean too much from this sort of measure at all. I mean, what is the correct rate of housing growth relative to population growth? Is it zero? Can we proclaim a housing shortage if housing units per capita are increasing at all?
If we’re being clear headed, there is no baseline we can claim as neutral. We have no basis for making the determination of what the correct amount of housing is. And, in fact, one sign that we have a supply problem is that people commonly treat housing consumption as if it is a moral dilemma - boomers buying up homes, the scourge of short term rentals, foreign buyers, private equity landlords - the media is scattered with “how dare they take our housing” complaints about the ownership or consumption of housing by others.
Compare this to other goods and services. There is a chip shortage that appears to still be delaying production of automobiles. How many articles have you read claiming that the car shortage is a made-up problem because we consume many more microchips than we used to, and we just need to stop using the chips we have for banal products like gaming systems?
Supply constraints are the water we are swimming in, and so when the discourse is full of debates about who has a right to consume something, you can bet that you’ve got a supply problem.
And, when supply is constrained, consumption becomes combative. When there are critical supply shortages, they don’t play out evenly. The costs are mostly borne by those least able to handle them. They lose the bidding war for what’s there. The runt of the litter has a rough road.
Until 2007, if you were a “runt of the litter” in Los Angeles, at least Las Vegas or Phoenix could serve as your foster nurse. Before 2007, homes/capita moved in a similar direction in most cities, and the way that happened is that families moved out of places like LA so that its population growth reflected its homebuilding activity, and into places like Las Vegas where it homebuilding activity then reflected its additional population growth.
The result of cutting off the top of the Las Vegas construction cycle is that rent and price patterns that had largely existing in places like Los Angeles are now spreading throughout the whole country.
You have to wonder how much of the sharp decline in national population growth since the Great Recession is the result of the Los-Angelesification of the American housing market. It doesn’t explain all of the decrease, but it certainly explains some of it - maybe a lot of it. How much of the rise in anti-immigrant sentiment is a product of broken housing? How many couples are delaying their decisions about have children because they can’t afford the extra bedroom?
In the previous post, I described the systematic relationship between population and homebuilding. Where there aren’t enough homes, population flows must take up the slack. The personal costs created by inter-metropolitan migration are bad enough. How tragic are the personal costs that can add up to a change in the population growth rate of a whole country?
The only way to cure that is to have an extensive period where housing growth is far above the rate of population growth. And, if that ever happens, there will be a perennial debate about how overstimulated and over-subsidized housing is. “How can you say that there aren’t enough homes? We’ve been building homes nobody needs for years!” And, if, knock on wood, those days ever come, it will be important to remember that there isn’t much value in trying to answer those challenges. It’s the wrong question. It’s a distraction, whether sincere or not, from questions that matter.


These recent posts have been a good synthesis of the major points of your research. Occasionally, I catch myself grumbling about your focus on the Great Recession---"why is Kevin obsessed with stuff that happened nearly 20 years ago...." Then, I remind myself that the 2005-2009 period was exceptional because Fed policy was bad for longer than it should have been. In retrospect, it wasn't a causal event in our housing problems, but rather a revealing moment. I don't feel comfortable making the claim that zoning regulations caused the Great Recession, although they played, and continue to play, a big role in price variations. I think that a big problem, which feeds zoning regulations and other bad policy decisions, is the attitude that American homeowners have about their house as an investment vehicle that is supposed to outpace NGDP growth rates. This attitude feeds a lot of intergenerational strife, to say the least.