You’ll see a lot folks who are skeptical of the housing supply problem who will compare the growth of households with the growth of housing units, or population growth with the growth of housing units. They will find that some area has built homes at a faster pace than household or population growth over some period of time and then argue that this shows that there isn’t a housing supply problem.
Obviously, the household measure is not very helpful. It’s hard for the number of households to increase if the number of houses does not. But, even population isn’t very helpful in this regard.
I will be going into this a bit more in a new paper. In my recent papers, I have shown that the relative cost of housing in poor neighborhoods versus rich neighborhoods is a dependable signal of regional supply constraints. In an upcoming paper, I will highlight evidence that suggests that population trends over a business cycle are also a signal of extremely constrained housing supply.
Anyway, there are plenty of ways to see that supply constraints are severely binding in many housing markets - rising rents, rising rent/income, migration patterns motivated by relative housing costs, homelessness, young adults remaining at home longer, delays or outright obstruction of many housing types, etc. Housing units/capita is a weak indicator but in a way that I think helps to see some facets and signals of the supply problem.
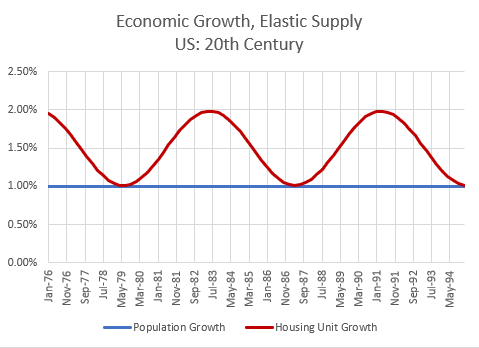
First, here is a very simple cyclical model of how housing construction and population growth might interact over time. In Figure 1, I have assumed a 1% population growth rate, a perpetual rise in housing demand of 0.5% annually (smaller households, second homes, vacation homes, etc.), and a 1% peak to trough housing cycle. At the bottom of the cycle, housing expansion would roughly match population growth, and at the top of the cycle, housing expansion would be roughly double population growth. In other words, at the peak of the cycle, for every home built for a typical new family, there would be an additional vacant unit or some equivalent reduction in the intensity of use. A society experiencing economic growth over time will naturally expand its use of normal goods and services, including housing.
In Figure 2, I have reduced population growth to 0.6% and annual growth of housing demand to 0.1%, but I have kept the cyclical impulse the same.
Really, these two simple models roughly describe the American housing market before the 1990s (Figure 1) and after the 1990s (Figure 2). A rough estimate in the growth rate of the housing stock and population growth are shown in Figure 3 from 1965 to 2023.
Basically, you can think of the housing market and the housing cycle this way.
Housing = Population * Homes/Resident
At the national level, population growth (at least until recently) tended to be relatively stable. There has generally been ample migration within the country, so there may have been a lot of variation in the location of the houses - some cities grew by 5% annually while others didn’t grow at all. But the national numbers reflected a basic level population growth and a highly variable cyclical rate of change in household size, vacant or second homes, etc.
Most cities should resemble the basic cyclical pictures above in Figures 1 & 2. The difference is just the population growth rate. In cities like Phoenix, that have grown a lot, the housing cycle in Figure 2 might fluctuate around a population growth rate of 2% or 3%. In Detroit, population growth has been low or negative, but historically, building rates still fluctuate depending on market conditions.
However, there are some American cities that have an effective cap on housing production. So, instead of a normal cycle like Figures 1 & 2, the top is chopped off like in Figure 4.
Now, the thing is, just because you’ve chopped off the top of your cyclical housing production, you haven’t changed any of the motivations for more homes - smaller households, kids moving out, empty nesters, second homes, etc. What if we rearrange our simple equation:
Population = Housing / (Homes/Resident)
If changes in homes per resident are mostly related to national economic and demographic trends, then it will change over the course of a cycle, but it will act on the city’s housing market at any given time as a constant. And, so, in a city with a capped housing supply, the thing that must give is a city’s population. In a city with a chopped off housing cycle, Figure 4 is a stylized picture of its housing and population trends. It will, necessarily, have below average population growth that is countercyclical. The better off the country is economically, the more housing demand per capita there is, the lower the population growth of these cities will be.
Figure 4 is basically a representation of New York City, Los Angeles, San Francisco, and Boston. The annual statistics for Los Angeles are shown in Figure 5. This is another way to tell if a city has binding supply constraints. Los Angeles has developed a supremely odd pattern - its population growth has become negatively correlated with even its own local rate of housing production. No wonder the local NIMBYs are convinced that building more homes isn’t the answer!
See, the thing is, just because you have a housing supply crisis, that doesn’t make cycles go away. But it does make it so that cycles are simply an acceleration of an ongoing clamoring for shelter where everyone loses, but the most needy, vulnerable residents and families lose the most.
But, back to the basic point of this post, when you see someone making the ridiculous claim that, say, California, or London, or Vancouver, has plenty of homes because the rate of housing construction has been higher than the rate of population growth, they are measuring something that just doesn’t convey any information at all about housing supply conditions.
It won’t seem ridiculous to them, because there is a simple logic to it. The measure seems to confirm their suspicion. But the reason that population trends relative to housing growth trends tend to suggest that there aren’t regional housing shortages is because the measure could never possibly show that. In fact, a highly constrained city will be creating the most housing-motivated displacement when it is building the most.
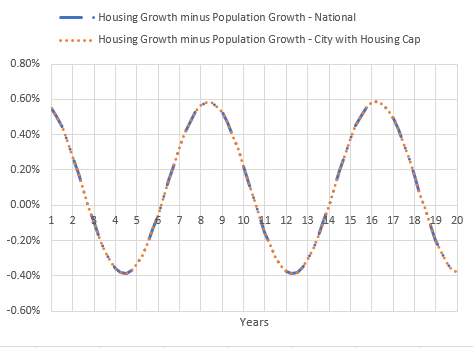
Figure 6 shows the difference between housing growth and population growth in both Figure 2 and Figure 4. In other words, the red line minus the blue line. They are the same. By construction, both scenarios featured the same cyclical impulse.
Figure 7 compares Figure 3 and Figure 5. The actual data of housing growth minus population growth for the US (black) and Los Angeles metro area (green). Pretty similar. When you have extremely constrained housing supply so that there is no top half of the cycle, cyclical fluctuations will find some way to play out. The difference is that it is population that changes instead of housing production. The way population changes in that case is that poor residents are economically displaced. So, the NIMBYs that become convinced by their own visceral experience that more construction only makes things worse, also become convinced that rent controls are the most important policy response, because the construction activity appears to displace poor people. And, the correlation is true! In perverse Los Angeles, if I told you that in 2030, LA will lose 1% of its population, you can bet that 2030 will be a banger of a year for housing construction in LA.
So, we end up with two types of supply skeptics, who appear to have empirical backing. One group says there’s plenty of supply, just look how many homes we’ve been building! The other group says new homes don’t help. Neither will be moved.
Oof.
Imagine having even a slight motivation to distrust market activity combined with these hurtful personal experiences and observations of displacement. Housing obstructionism is parasitical. Like a praying mantis with intestinal worms, a host who has become infected with obstructed housing will volunteer to its own demise.


I love this. Or more accurately, I hate that you have to do articles to address the madness that comes from people who claim we don't have a housing shortage. Incidentally, Boston might be starting to go through population decline/housing growth cycle. What could be worse over the next few years is policies being proposed by the mayor for rent control and increased builder offsets--so housing production could slow down even more. Everyone who talks big about affordability doesn't say a damn word about zoning reform.
This might be only loosely correlated with the issues you raise in this post, but communities that have seasonal populations can skew housing-per-capita data. The island of Nantucket has a huge surplus of dwellings from October through May. A rich person with two houses who builds a third house increases per capita stock. Some of them should start considering Downton Abbey-like solutions for their servants.