
Revisiting One Last Funny Chart

Sorry. This is a bit messy. Too many axes to get on one chart. I realized that I’ve posted the Phoenix price and Fed Funds rate chart before. And I’ve posted a chart of construction, prices, and debt in Phoenix or Arizona before. But, I never walked through them all together.
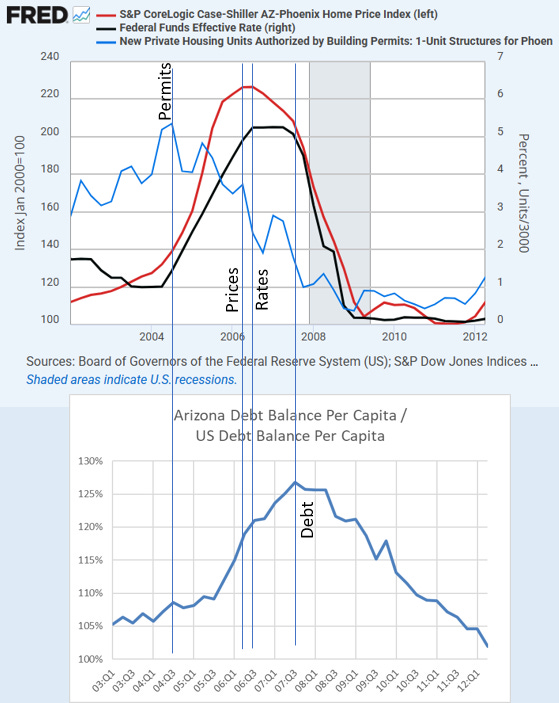
The chart with Phoenix prices and the Fed Funds Rate is funny because low rates are supposed to coincide with high prices, not high rates. But, it’s funnier than that.
Conventional wisdom is that low rates led to reckless borrowing which led to a price bubble which led to speculative building. It’s seemingly so obviously true that apparently nobody looked.
The actual series of events was: First, there was a wave of in-migration from Los Angeles because Los Angeles didn’t and doesn’t have enough homes. Their supply of housing is almost perfectly inelastic, so as incomes rise and the economy improves, and consumption of everything increases, including housing, Los Angeles’ carrying capacity declines. Los Angeles is at a self-imposed Malthusian limit. Every bit of economic growth requires an equal and opposite amount of economic decline, either through rent inflation or regional displacement.
A lot of those migrants go to Phoenix. I suppose you could argue that the migration boom into Phoenix was related to low interest rates. As we conceive of monetary policy under the current regime, higher rates would have slowed the economy down. Poorer Angelinos would have consumed less housing and fewer of them would have needed to move to Phoenix.
I have speculated before that maybe if that had been the Fed’s MO it might have worked. Raise rates until the migration flows are just low enough not to overwhelm the destination cities. But, I’m not sure. When they raised rates, it immediately had a dampening effect on new home construction in Phoenix, in mid-2004, but the migration surge continued until mid-2006.
In fact, that is why Phoenix home prices spiked. The Fed slowed down construction when the problem was that there weren’t enough homes. Would there have been a housing bubble if the Fed had kept the target rate at 1% for longer? Is that a crazy question? Or is it the self evident question?
Prices finally stopped rising in the second quarter of 2006. The next quarter, the Fed stopped raising their target rate. Single-family home permits were at half of the peak level by then. The reason prices stopped rising then is that the Fed had slowed the economy down enough that the surge of migrants from Los Angeles finally abated. (The best way to pick up these sharply changing trends is in monthly employment data.)
The last of these measures to rise sharply was debt. Debt outstanding in Arizona really jumped in the 4th quarter of 2005 and continued rising until the 3rd quarter of 2007. The unusual rise in debt didn’t happen until more than a year after construction had peaked and had fallen 30%, home prices were near their peak, and the Fed Funds Rate was at 4%.
Again, I suppose conventional wisdom has some hazy claim to facts here. Everyone believes that there was a lot of reckless borrowing late in the cycle that turned into defaults and foreclosures when the bottom fell out. It’s just that that borrowing had nothing to do with a building boom and was really more of a product of the price boom than a cause of it. And the price boom itself was mostly associated with declining construction activity with a rising Fed Funds rate.
Oh, and that dumb money that was piling into investment homes in 2006 and 2007? They were buying into a market where prices were flat while 10% rent inflation was accumulating. And why was there suddenly 10% rent inflation over the course of 2006 and 2007? Well, because Phoenix was suddenly building homes like it was LA.
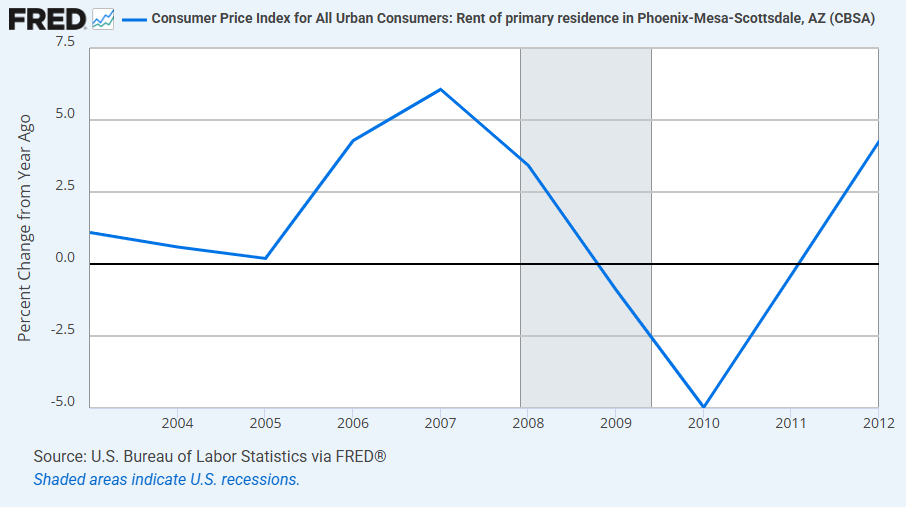
But, then the migration spike from LA suddenly ended and rent inflation swung from 6% in 2007 to -5% in 2010. I guess those dummies should have seen that coming. After all, Phoenix was clearly oversupplied. Right? I mean, clearly. It’s so obvious you don’t even need to look up the permitting data to know how dumb they were.
Those are the dummies that Richard Fisher argued needed to be disciplined before he could justify lowering the Fed’s target rate in September 2007.
(W)hen the Fed was debating what ended up being a rate cut to 4.75%, infamous FOMC hawk Richard Fisher worried, “I’m very concerned that we’re leaning the tiller too far to the side to compensate risk-takers when we should be disciplining them.”
While Leamer had concluded that rate cuts couldn’t even help stabilize the housing market, Fisher worried that they would.
A year later, while the financial world was exploding, Fisher was on the speaker circuit explaining that “perhaps no financial system—no matter how enlightened its central bank or sophisticated its regulatory architecture or wise its Congress or executive—can prevent nature from running its course.”
Phoenix permits for single-family homes issued in September 2007 were 82% lower than the July 2004 peak.
Low rates were associated with a building boom in Phoenix, but the building boom wasn’t strong enough because Los Angeles has outlawed building booms and created a wagon train headed east. Raising the target rate had the most direct and immediate effect putting a stop to the thing that Phoenix needed more of.
So, what should a person do here? Chuck the credit bubble narrative into the midden pile and start fresh with a supply side story (that did have a credit boom attached to it)? Or try to salvage the low rates cause debt which cause high prices which cause an unsustainable building boom narrative?
That’s a lot to ask someone to chuck.
I should make clear that nobody needs to pretend that there wasn’t a credit boom, that a lot of that debt, when it did finally accumulate, was risky, and that it was related to the way the crisis played out. There are important questions of causality here, but boy is that a lot of canonized presumptions to ask people to set aside..
It seems reasonable to have a “Why can’t it be both?” reaction. But is that really how you should react to a set of empirical details that are practically diametrically opposed to the charts as you might have imagined they should look based on the canonized narrative?
In practice, I think “Why can’t it be both?” ends up functioning either as a crutch to hold on to the false narrative or as a baby step through which someone eventually loosens their embrace of it.
Given how cyclical housing construction has been over the past 70 years I'm curious if the Fed had previously demonstrated such interest in production rates as they did in the 2005-2006 period.
Off-topic, thanks for the link to the Reason article you posted on Twitter about the proposed Senate housing bill. If a good housing policy bill is passed in the Trump administration I'll eat my hat, but if it happens I'll take it. I don't trust Warren---even though she's one of my senators---but if she continues to support the bill it will help. The political framing could be interesting:
-Southern Republicans get to continue owning the Libs because it will help their states more.
-Liberal policy wonks get some federal support for zoning reform.
-Trump won't care about or understand the bill and will just enjoy signing it with a golden pen.
" Los Angeles is at a self-imposed Malthusian limit."
oh man oh man, it is so funny and so sad when you put it that way.