

If we fixed American land use regulations and mortgage financing, there would be a building boom. I estimate 15 to 20 million units are needed above the neutral trend to reverse excess rent inflation. And, the Closed Access cities (New York City, Los Angeles, San Francisco, and Boston) have the most potential to grow, because before the mortgage crackdown in 2008, they had clamped down so tightly on their local housing markets that they were bleeding out housing-poor families. The main cause of the 2000s housing bubble was the mass exodus of families from those cities.
So, it is true that there are millions of families who would choose to live in those cities if there was enough housing. I have estimated a shortage of about 4 million homes in those 4 cities, collectively, based on the deviations in their home prices measured by the Erdmann Housing Tracker, relative to a 15 million unit shortage nationwide. That equates to a capacity to house about 9 million additional residents.
But, here’s the thing, filling the 15 million nationwide gap wouldn’t necessarily be associated with rising population. It would mostly just entail more households and more vacant homes among the existing population.
The shortage, estimated by price trends in the Erdmann Housing Tracker, is nearly twice as high in the Closed Access cities as in the rest of the country. The rest of the country has a stock of housing that is about 10% too small, and the Closed Access cities’ stock is about 18% too small. So, assuming household formation trends would be similar across cities, 4 million new homes in the Closed Access cities might be associated with an increase of about 4 million additional residents.
My point of view is that the price of homes under the conditions of a shortage is set by the willingness of the marginal family weighing the choice between paying elevated rents and choosing to be regionally displaced. In the case of the Closed Access cities, the 4 million additional residents that would eventually live there as a result of 4 million new homes would generally be the families that have otherwise been forced, or will be forced, to move away. They are the ones setting the prices tracked by the Tracker which I used to estimate the shortage of homes.
So, the question is: How many additional families would move into the Closed Access cities aspirationally if they were more affordable. As I frequently assert, I think this notion has been highly overstated. Most of the residents that would like to live in those cities have moved to those cities. They might live in smaller homes, or homes with longer commutes, or with roommates, but there is a lot of margin to compromise on in those categories if you really want to be somewhere.
I assert that most of the families that want to live in the Closed Access cities, but don’t, are families that used to live there and have been displaced from them. I don’t have a good way to quantify that assertion because the hypothesis is so far out of sample, there is no way to confidently support the claim in either direction. It’s been a long time since any of those cities has approved remotely enough homes to attract net positive domestic migration.
Since 1969, the metropolitan area with a growth rate closest to the US average is Columbus, Ohio. The Closed Access cities have a combined population of about 42 million residents. If they had grown at the rate of Columbus, Ohio since 1969, they would have about 59 million residents.
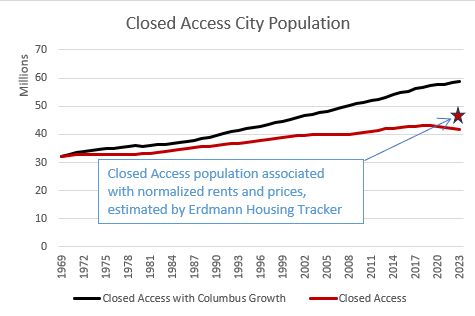
If the US built 15 million new homes, it would take about 6 million homes, in addition to the 4 million homes estimated by the Erdmann Housing Tracker, for the Closed Access cities to grow enough to catch up with Columbus, Ohio.
10 million out of the 15 million homes needed nationally would have to be built in the Closed Access cities for them to just get back to average. Current price trends suggest that, if there is no pent up demand for moving to the Closed Access cities, 4 million additional residents would be associated with a reversal of excess rent inflation. An additional 13 million residents would have to move in in order to get growth up to average. That’s 3 new aspirational residents for every 1 former or existing resident reversing or avoiding displacement.
I think that’s a high number to expect. And, that’s just for them to be average.
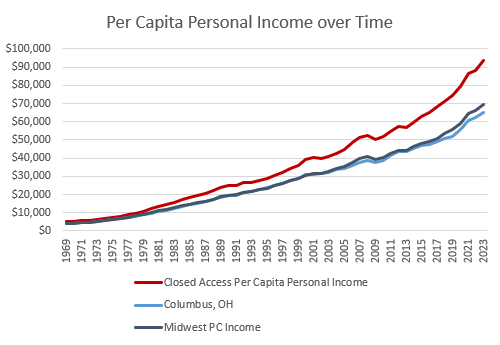
Of course, the claim that everyone in Columbus is dying to get to New York City is that incomes are much higher in New York City, shown in Figure 2. Closed Access incomes used to be about 20% higher than they were in Columbus and the Midwest, but now they are more like 40% higher.
But, total income growth tells a different story. Incomes in Columbus never stray far from the Midwest average because in the Midwest, traditionally, families can move to the cities they want to move to. Economic success doesn’t lead to rising average incomes. It leads to newcomers and population growth.
So, as shown in Figure 3, total income growth in Columbus has outpaced the Closed Access cities significantly. The Midwest as a whole trails the Closed Access cities. But, they are closer to the Midwest average than to Columbus. And, remember, Columbus has had average growth. As a group, the Closed Access cities are closer to the Midwest average for total income growth than to the average US city.

Of course, the reason is that population growth in the Closed Access cities has been much closer to the Midwest average than it has been to the US average or to Columbus, shown in Figure 4.

So, what about those high per capita incomes? Here is the Midwest, compared to New York City. I have deflated the incomes with the aggregate consumer price indexes (in the lighter tones in Figure 5) and with an index that excludes rent inflation (in the darker tones in Figure 5). Essentially all of the extra income in New York City is eaten up by rent. And, now, unfortunately, because we have created a nationwide housing shortage, rents are starting to eat into Midwest incomes, too.

As I have written about in other posts, one of the tragedies of the 2008 debacle was that the moral panic was a reaction to high home prices in Florida and Arizona, but it was the Midwest that has ended up suffering the worst in many ways. So, real income growth that reflects local rent inflation was similar in the Midwest and New York City in the 2 decades leading up to the financial crisis. Then the Midwest really took a hit.
Yet, despite that, real incomes in the Midwest had nearly caught back up to New York City by 2019. The gap has reappeared since 2020, but keep in mind that this has coincided with an especially sharp recent downtrend in New York City’s population.
You might argue that this is the point. Incomes are high in the Closed Access cities, so aspirational newcomers are willing to pay the housing premium to get into them. And, that is certainly true, but how much does that affect the income premium, and how much additional residents does it attract. The Closed Access cities don’t have unusually high in-migration or migration churn. They have pretty normal in-migration and very high out-migration. And, the out-migration is very skewed to residents with lower incomes.
So, there are 17 million residents missing from the Closed Access cities (40% of their current population). These have largely been families from the lowest two income quintiles who chose displacement over housing poverty and moved away, mostly over the most recent 3 decades.
Surely, the compositional effect of that shift has been huge. It seems to me likely that it accounts for more than the 20% marginal rise in per capita incomes in the Closed Access cities compared to the Midwest and average cities in the rest of the country.
In other words, if homes get built, rents will decline in the Closed Access cities. If the 17 million families that were displaced from the Closed Access cities by high rents decide to move back, average net incomes after rent won’t rise. Average gross incomes will decline.
The Closed Access cities will look more like the Midwest in Figure 5, both before and after rent.
Now, it is true that even in 1969, the Closed Access cities had relatively high incomes. There apparently were agglomeration economies associated with those locations. And, obviously, there were times in their past when they grew at above average rates. That’s how they got big.
But, the claim that tens of millions of Americans would move there, to the point of depopulating the rest of the country, is simply not supported. When they used to permit enough homes, it didn’t cause the rest of the country to depopulate. And, the idea that it would today comes from the overestimated agglomeration value they are said to have because they displaced their 17 million poorest former residents.
But, hey, if all 15 million units in an American corrective building boom end up being built in the Closed Access cities while the rest of the country stagnates, then I will be happy to agree that they are above average, and that they had the potential to be above average all this time.
To get to average, they would need to permit new housing at Austin tier rates for a couple of decades. So, we have some time to prepare for the depopulation of the rest of the country, if it ever comes to that.
Most of the displaced residents moved to places like Florida and Arizona (remember the 2000s), so the 1st order population shift that would be related to the return of displaced former residents would likely be associated with lower growth rates in the country’s fasted growing regions, not a decline in growth in lower growing regions. One important reason the fastest growing places have been growing fast is because they have been the overflow destinations from the below-average Closed Access cities.
"When they used to permit enough homes, it didn’t cause the rest of the country to depopulate."
That was in a time with a much higher total population growth rate, no?
That's my only gripe. Good post on something I think about fairly often!
It's funny how New York City can nearly always be used as a unifying--or dividing--narrative device for so many cultural and economic issues. Your post happens to use it correctly, but so much of the emotionally charged rhetoric in this country magnifies its importance beyond the scope of reality. For many people it is the Center of the Universe when it comes to art, business, power, and politics. For many on the right it is the ultimate symbol of corruption and liberalism run amok. For the New Urbanist Jane Jacobites it is the Holy Grail of density and walkable perfection, and the rest of the country is a car-ridden hellscape.