
5 Million Vacancies

I am probably repeating myself from some old post, but after I wrote:
To get back to normal, we would need at least 15 million new homes. Roughly counting, about 2 million would be owned, 8 million would be rented, and 5 million would be vacant.
in yesterday’s post, I thought it might be worthwhile to do a quick check in on vacancies.
You can get to various counts of 15 to 20 million units needed to return to normal by counting deviations from trends in rent inflation, housing starts, adults per family household, net residential investment, etc.
Tracking long-term deviations in residential investment can even get the unit-equivalent numbers well above that, because in the YIMBY utopia, many households living in 800 square foot apartments today might upgrade to 2,000 square foot condos. Those renovations or replacements wouldn’t be associated with an increase in units, but they would be associated with more residential investment.
Anyway, you can get to the 10 million new households by comparing the current number of adults per family household to the long-term trend, which would have about 14 million fewer of those adults living in the number of homes they currently live in.
The vacancy claim is pretty straightforward. There are a couple of issues here. First, the Census Bureau’s long-term estimate of the portion of homes that are vacant shows vacancy rates in the mid-20th century that are lower than the current vacancy rate.
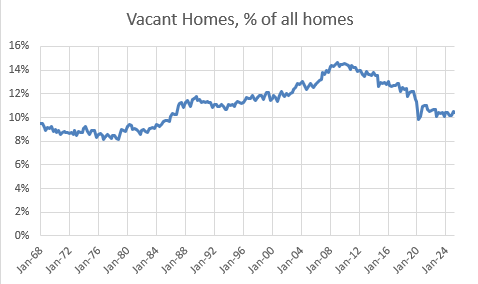
This is not a stable measure for a couple of related reasons. As far as I can tell, the rise in the late 1980s is mostly related to a change in methodology, where they started counting seasonally occupied mobile homes as vacant units. Part of the reason for that change in methodology is that seasonal retirement communities were a mid-20th century phenomenon. It was a new thing to count. And, so, part of the rise happened because of the methodological change, and part of the rise happened over time as seasonal retirement communities spread.
Becoming wealthier as a country is associated with more consumption, including more seasonal homes. I find vacancy truthers especially bothersome. (“We have 3 vacant homes for every homeless person. Tax the pieds-à-terre until the wealthy oligarchs move out, and then we’ll have plenty of homes.” Etc.) This misses the mark in several ways. First, vacancies are an important part of a functional marketplace that allows for movement, migration, demand shifts, etc. without triggering price bubbles. If we had 5 million vacant homes, home prices wouldn’t have spiked when post-Covid migration surges happened.
Second, to the extent that vacancies are associated with consumption of housing beyond a minimum subsistence level, a lot of it is very middle class. Those pieds-à-terre are rhetorically charged, but a bunch of semi-retired farmers and retired school teachers spending the winter in $70,000 park models with golf carts in the driveways is hardly a picture of an economy full of oligarchs. “We have too many vacancies and we should just use them more intensively” is never going to be a part of a productive point of view on housing.
Neither the beginning nor the end of the 21st century housing crisis has been or will be related to the number of park models sitting empty in Phoenix in June. But, that upward bias in late 20th century vacancies, together with the conventional mythology that associates the 2000s housing boom with a supply glut, creates a seemingly obvious first impression, for anyone viewing Figure 1, that a 11% or 12% vacancy rate might be a neutral benchmark, and it could even be lower than that.
And, that’s just wrong. The vacancy rate was too low in the late 1990s, and rent inflation was perpetually excessive. Your intuition should be that, under current conditions, including the millions of seasonal park models that are vacant, a 12% total vacancy rate isn’t high enough to expect neutral rent inflation.
It was only in 2005, when the total vacancy rate started tickling 13%, that rent inflation, very briefly, almost went neutral.
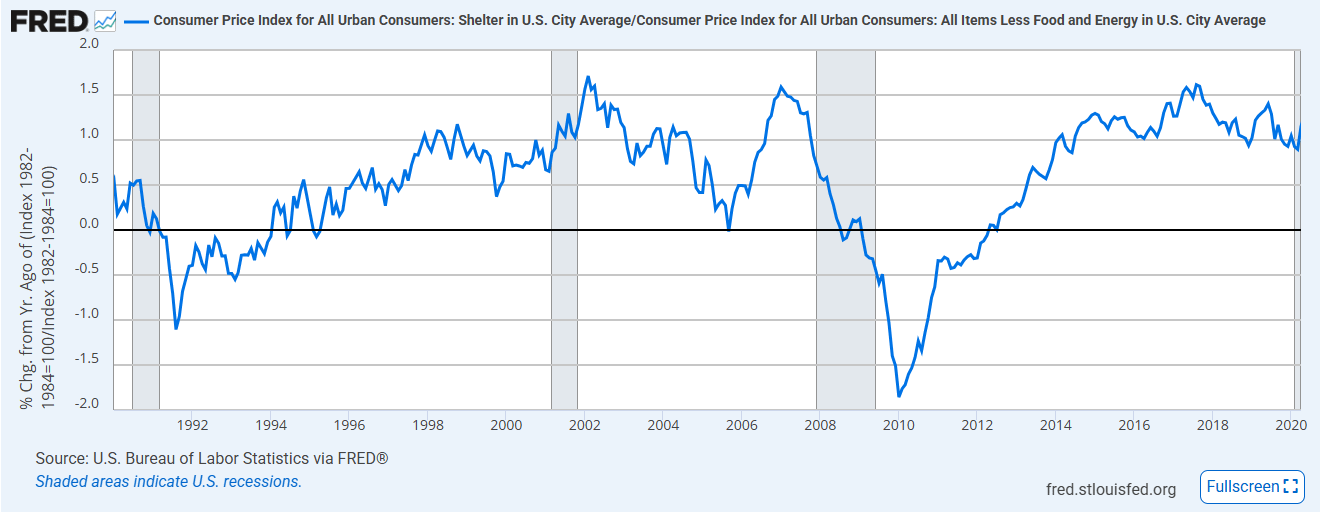
There was never a glut of housing anywhere. Declining rent trends and vacancy rates above 13% were a lagging effect of the housing crash. First vacancies climbed in 2006 & 2007 while rent inflation increased because the Fed had collapsed the construction market, and there was some disarray involving vacant homes for sale even while supply of new homes started to deviate below a sustainable trend. Then, the foreclosure crisis and the deep recession were associated with flat rents and high vacancies.
Perennially inflated rent was back by 2014 when the total vacancy rate was still above 13%.
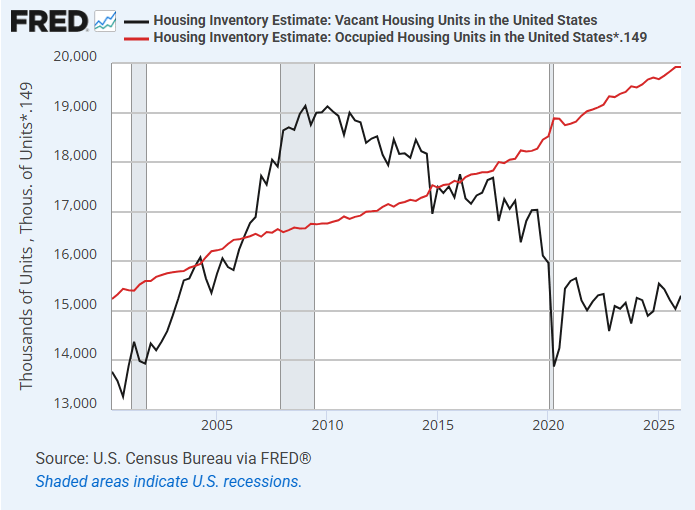
In Figure 3, I compare the measured number of vacancies to a running vacancy rate of 13%. Rent inflation has been elevated whenever the actual number of vacancies has been near or below that target number. As a baseline estimate, I think you need a good reason to look for a better one.
I think many of the very low estimates of the housing shortage, in the range of a million or a few million, measure the shortage purely as a lack of vacant units, making no account of the pent up demand for household formation. And, then they lowball the benchmark vacancy rate for the reasons I have noted above.
Figure 3 is pretty straightforward. There are 15 million vacant homes right now, and no number of vacant units that would add currently to less than 20 million units has been associated with moderate rent inflation for at least 30 years. If you’re benchmarking to less than 5 million extra vacant units, I think you’re benchmarking to permanent rent inflation.
This is a very astute reflection on the functional meaning and necessity of vacancy rates in the housing market.