
What's Driving Home Values (Part 5)

So, rents are at least involved in basically all of the relative aggregate changes of home values over time. One question is, what influences the slope of the line (factor number 3 from Part 4). And, look, I’m a finance guy at heart. Discount rates are hugely important in asset values. I get it. It’s the first thing I look for in any valuation. I would be happy to give interest rates a prominent role in the slope of that line. I just can’t manage to find it.
Here are charts from one of the previous posts. The left panel is the correlation between rent and price/rent over time. In other words, how closely did the price/rent levels in each metro area align with the regression lines in Figure 1. Since 2005, the fit has been pretty strong. Differences in rent explain most of the differences in home prices between the various metro areas.
The right panel shows the slope of the regression line in Figure 1 for each quarter from 1979 to 2018. Basically, the right panel is a measure of Factor 3 listed in Part 4 in the aggregate value of US residential real estate, and shown in the first figure here.

So, here’s my problem. It is very easy to imagine that where rents are excessive because of constrained supply, more real estate value comes from the future growth of rents, and the present value of those future rents will be more sensitive to interest rates. So, how do we set up a model to estimate that?
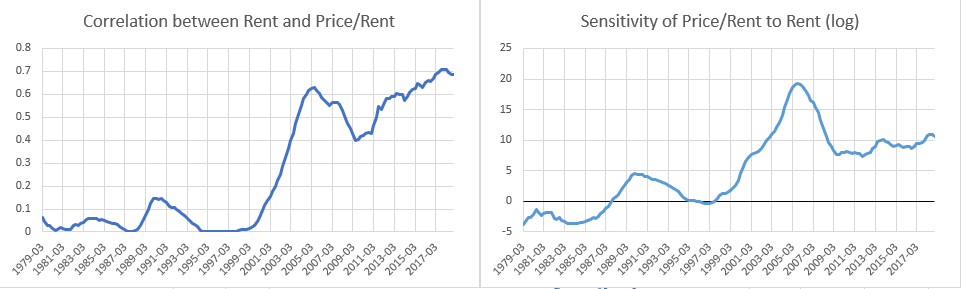
Well, one big problem is that there was no such sensitivity, or at least very little sensitivity, before the turn of the century. It might be possible to try to quantify the regime shift with some sort of measure of expected rent persistence and then to interact that measure with interest rates. Maybe after the 1990s we went from a regime where rents were expected to revert to a norm to one where they are expected to continue to diverge where they are high. So, in order to ascribe changing prices to interest rates, they have to be interacted with this unmeasurable expectation variable.
But, even if we try to plug that amorphous variable in, I’m not sure the model can find any significant correlations with interest rates.
Trying to Find an Interest Rate Influence
Figure 3 compares mortgage affordability (the % of the median income required to pay the mortgage payment on the median house, which used to be tracked and published by Zillow for the US and metro areas.) for LA, Atlanta, and the US median.
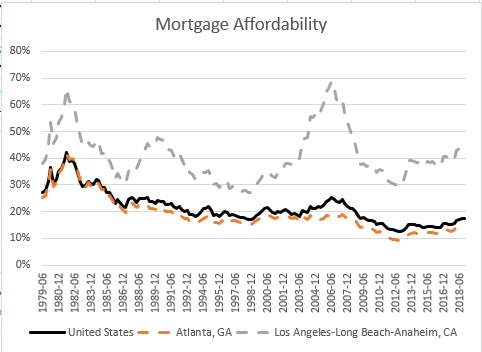
The Atlanta and US measures, from about 1986 to 2007, appear to follow the “credit constraint” theory of interest rates that is the implicit model used in everyday discourse about the effect of mortgage rates. In that model, households consume housing up to the constraint of the maximum mortgage payment they can qualify for. And, from 1986 to 2007, in Atlanta, and in the median US home, on average, that amounted to a mortgage payment equal to about 20% of household income.
But, that model breaks down before 1986, when mortgage rates were very high. Historically, higher mortgage payments didn’t actually impose a constraint on buyer demand that put much downward pressure on prices. For instance, taking mortgage payments out of the mix, most measures of things like price/income don’t really show any weakness when mortgage rates were high, as shown in Part 2.
There is another way to think about interest rates, and that is purely a reflection of the discount rate on future rents. Los Angeles could possibly salvage a role for interest rates in this regard. When rents and price/rent sensitivity spiked in the late 1980s and especially in the 2000s, the mortgage payment required for the median LA home spiked.
Keep in mind, this explanation for the influence of mortgage rates is really the opposite of the credit constrained explanation. Here, the mechanism is that buyers are completely unconstrained by mortgage access, and when rents are expected to be persistently high, low interest rates multiply the value of those future rents, so that the lower the rate, the higher the payment would be for a buyer in LA. In fact, in later posts I will look within cities, and within the LA market, there are ZIP codes where the median mortgage payment would require more than 100% of the median resident’s income. So, to believe that the slope of the line in Figure 1 is sensitive to interest rates, you would need to both (1) disbelieve the idea that high rates curb prices through a credit constraint mechanism, and (2) attribute a significant scale to the effect.
If you can manage to do that, you’ll still run into a problem, which is 2009-2011, when interest rates dropped sharply while prices collapsed in both Atlanta (contradicting the constrained credit model) and Los Angeles (contradicting the present value model).
That is where the credit component of the Erdmann Housing Tracker may help. I’ll leave that for future posts.
Yes, more posts that look at the rents/interest rate/house price trifecta. Please don't worry about being repetitive---think of how many times doctors have to tell patients to lose weight and quit smoking.
I'd like to share a story from the 2009-2011 period which could help demonstrate the weirdness that I think reinforces your point. My aunt was going through a divorce and trying to get sole custody of her house. She had to get some sort of a bridge loan to buy out her ex and could only get a 5 year note with a nosebleed rate---even though official rates were low NOBODY was doing normal lending. She took it because a) she had no choice and b) she expected her home value to increase and she'd be in a good refi position in a few years. She was right, fortunately.
I want to believe this time is more "normal" because 30 year notes are reflecting ostensibly tighter policy, but will demonstrate more market-based churn over the next year. For example, home sellers in high priced neighborhoods will cut prices to attract buyers who are negotiating from a standpoint of having to deal with high rates. But, these cuts will be in the range of 5-10% which isn't fire sale territory.
I am old enough to remember the high interest rate period before 1986. That is when a lot of mortgages with negative amortization were invented to enable borrowers to reduce their initial monthly payments. Teaser-rate ARMs and such got a lot of negative press during the Great Financial Crisis, so I don't think they will come back soon.
As an aside, would you be available on Monday evening to discuss the state of the economy and the housing market on a Zoom call with about a dozen people in the audience? If so, email me. arnoldsk at us dot net.