
What is the current neutral level of housing completions?

In my metro area data packages, I infer a scarcity lot premium from each metropolitan area. Then, assuming a price/rent ratio that differs somewhat from market to market and a decline in land rents of 2% for each 1% increase in the supply of homes, I estimate the neutral construction rate required to flatten and reverse rising scarcity lot premiums.
This isn’t quite as straightforward today as it would have been 6 years ago because the combination of the Covid pandemic and the odd effects a housing shortage has on the business cycle have created unusual deviations in housing data since then.
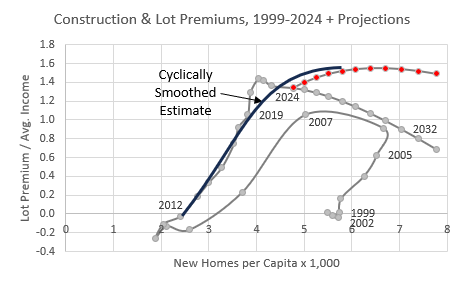
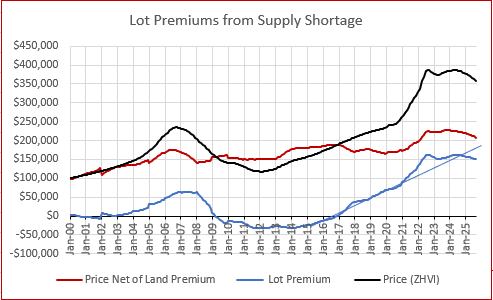
Figure 1 shows the average scarcity premium among the 32 largest metro areas. In a previous post, I drew in a projection based on continued increases in new home completions. However, after reviewing more of the individual markets, I think that projection is probably a bit optimistic about the reversal of lot premiums. I have added a different projection here, based on a higher level of neutral completions (the pace of new home completions required to stop excess rent inflation). This one may still be a bit optimistic, but I think it aligns more with what the cyclically neutral lot premium likely is (shown with the manually drawn black curve).
As I have discussed in recent posts, we have been in arguably recessionary conditions for the past couple of years, but the housing shortage puts a governor on the cycle, keeping us out of deep recession. The unemployment rate bottomed at 3.4% in April 2023 and is now up to 4.3%.
So, I think there are a few things going on that add a few odd blips to the scarcity lot premium estimates.
Recession and Rent
Housing has historically experienced sharp trend shifts through the business cycle. That used to be largely in construction activity. Under shortage conditions it comes more through price trends. So, in Figure 1, the annual dots kept drifting to the right (more completions) while a little spike and reversal happened in lot premiums. Conceptually, I wouldn’t expect scarcity lot premiums to have much cyclical sensitivity, but there appears to be some.
The simple trends in excess rent inflation are a bit misleading here, I think. The easy interpretation of Figure 2, and the one I was initially drawn to, is that there had been pretty steady rent inflation in the 2010s when new home production was well below a sustainably neutral rate. Then, there were a couple of sizeable wobbles through the Covid period, and now, with new home completions remaining stable through all of that, rents are settling in at a relatively neutral trend. This suggests that the recent pace of completions - about 1.6 million units last year - is near the sustainable pace of building that would flatten the accumulation of delayed household formation.
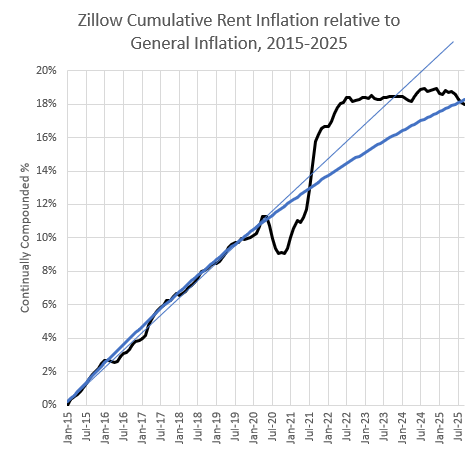
I have moved away from that inclination. Completions have continued to rise, and I think it has bent down the rent inflation curve. But, not completely. There is a combination of trends here. Persistent excess rent inflation is now lower than it was from 2015 to 2019, but it is not zero. It only looks like zero because there was a cyclical spike in rents followed by a reversal. I don’t think excess rent inflation will return all the way back up to the upward sloping linear trend shown in Figure 2, and I don’t think it will even return to the same positive slope of 2015 to 2019, but it will return to a positive slope until completions rise higher.
I have tended to include the linear trend line in Figure 2 that matches 2015-2019, but maybe the trend is more like the arched line. (There is nothing quantitative about the arched line in Figure 2. I’m just eyeballing it there to help visually imagine what is possible.)
Figure 2 measures accumulated excess rent inflation above the level of core CPI inflation excluding rent. That has been biased a bit recently by goods inflation related to Trump’s tariff policies, making rent inflation look temporarily better compared to general inflation. Monthly rent inflation, measured by Zillow, bottomed in April and has been trending back up since then. That’s not dispositive, but this is a path rent would be following if, in 2024, it had been a bit low because of these cyclical fluctuations.
However, this is all made even more confusing by population trends, which haven’t matched the recent cyclical fluctuations at all. At the same time that Covid-era migration and work-from-home trends ticked rent and prices higher, pandemic deaths and declining immigration were pulling population growth lower. Then, when rent inflation cooled off, in 2023 and 2024, immigration and population growth recovered.
This is counter-intuitive, because I am using a model that relates rent inflation to pent up household formation to estimate market trends. In the long-term, population and household formation will dominate trends. But, keep in mind that short term trends have always been susceptible to cyclical fluctuations. In fact, there isn’t really any historical comparison in modern American data for the sorts of population growth volatility we have seen the last few years. In any case, the other fluctuations have clearly outweighed the effect of changes in population growth.
Maybe short-term changes in population growth wouldn’t make much difference in housing markets even if we weren’t in a shortage condition. But, in a shortage condition, I think it is best to think of the market as tending back toward equilibrium rather than being in an equilibrium condition that is changing.
Over the long-term, I think each 1% increase in supply will be associated with about a 2% decrease in rents, and something around a 6% decrease in prices. But, that will be the result of 15 million (or so) households forming as supply allows it, slowly lowering the tension between the equilibrium price of housing under normal supply conditions and the disequilibrium we are in now while construction capacity continues to increase to where it needs to in order to get to that equilibrium.
If population growth ends up being 1/2% lower, annually, for the next decade, then we will reach equilibrium faster. But, If we are 15 million units short, and that bounces around between 14 and 16 million units over a volatile couple of years, it probably doesn’t affect the tension of the disequilibrium that much. On a month-to-month or year-to-year basis, changes in the number of unformed households probably won’t create volatility. On the other hand, changes in the short-term demand of 140 million existing households over the course of a business cycle will continue to have the same effects on short-term trends that they have always had.
Recession and Prices
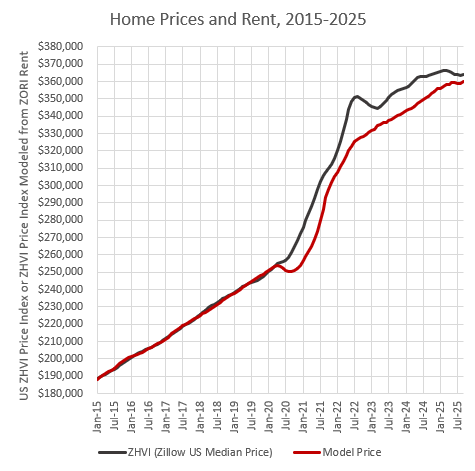
The scarcity lot price premium in my metro area packages is determined by analyzing metro area prices and incomes, though, not rents. That distinction doesn’t necessarily matter that much. As I frequently note, prices have almost completely been driven by rents, for most of the past 30 years. There was a slight deviation between the national price index and the national rent index, mainly in early 2022, which has now mostly dissipated. There was some cyclical variation, possibly inflated a bit by low interest rates. That has corrected. There also has been some apparent additional tightening in mortgage access since 2021, which might have had some marginal downward effect on prices.
I don’t have that much to say about this, but it does tend to add just a bit of an additional bump in the lot premium estimate. In Figure 1, instead of a relatively straight line from 2020 to 2024, there is that little bump in 2022. It doesn’t seem like much. In terms of the difference in valuation, it isn’t. But, if you’re trying to estimate what the slope of the lot premium trend is coming out of Covid, associated with the current pace of construction, it really makes a difference.
Recession and Individual Markets
This problem is amplified in individual markets. There was a migration surge along with the post-Covid housing boom, which hit some cities much harder than others. And, the dissipation and partial reversal of that migration surge has hit them harder too.
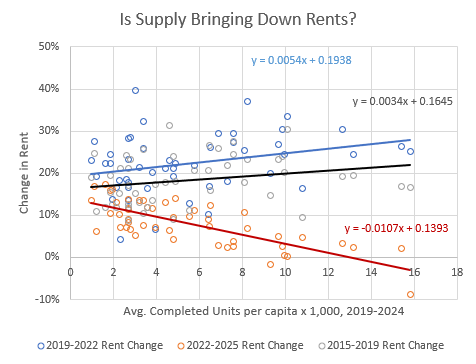
As I have written about recently, the recent correlation between construction rates and rent inflation across markets is overstated here. Figure 4 is from that post. Rent deflation is correlated both with the pace of construction and with the previous rent inflation. The Covid migration was concentrated in fast growing cities, and no city was able to build fast enough to prevent rent inflation from rising, so the bump in Figure 1 is larger in cities that build more.
The city I have been referencing in my examples is a fast growing city, and you can see these factors in the estimates for that market. Figure 5 shows the typical home price, and the price disaggregated between the scarcity lot premium and the price after subtracting the premium. Here, I have added a straight line tracking the premium from 2016 to 2020. I think the forward trend in the lot premium in this market will likely fall between the current trend and that linear trendline - something like the arched line in Figure 2.
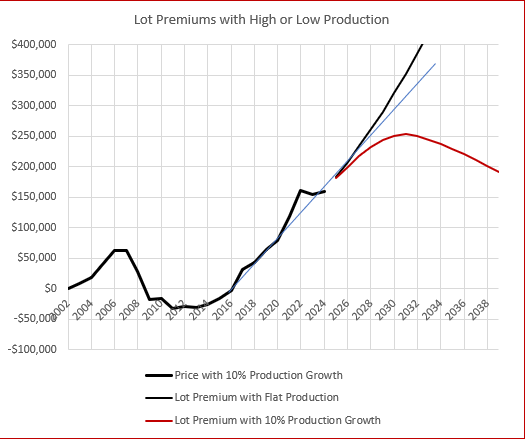
In Figure 6, I have applied a linear trend estimate to the projection of future lot premiums. My model shows the lot premium in this city continuing to rise by hundreds of thousands of dollars. That might seem extreme, but given the rent inflation and the lot premium that accumulated from 2016 to 2024, it would take a leap of faith to believe that the current pace of construction is anywhere near enough to arrest it.
I don’t think lot premiums will follow that path, because completions will continue to grow. The red line in Figure 6 shows the path of the lot premium with continued growth in new home completions.
The flat lot premium trend since 2022 seems to create dissonance here. But, all things considered, I think we should expect the projected path of lot premiums to generally return briefly to an upward slope, unless the broader economy faces some sort of catastrophic disruption (which, these days, isn’t completely out of the question).
A Cyclically Neutral Lot Premium Trend
Figure 7 shows total annual completed new homes across the US and the estimated number of completions that would have been associated with moderate rent inflation. The red dotted line is the 5 year moving average of estimated neutral demand.
Keep in mind, before 2008, rent inflation was regional. Before 2008, it didn’t add up to a national shortage. Homes were built, but they required migration out of the housing deprived markets. Rents were high in Los Angeles and homes were built in Phoenix. Since 2008, the shortage has been nationwide, so the rent inflation is associated with lot premiums in almost every city, and more homes will lower rents and lot premiums wherever they are constructed.
Before 2008, it was a matter mostly of where homes were built. After 2008, it has been mostly a matter of building homes anywhere.
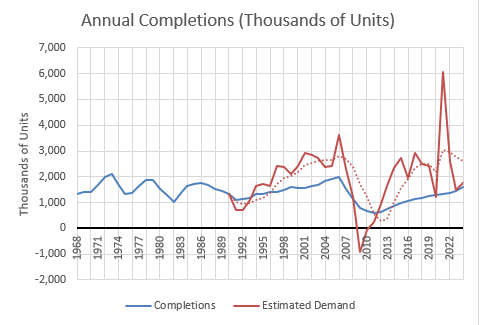
Over both the past 5 years and the past 10 years, the average annual neutral completions has been about 2.6 million homes. In 2024, about 1.6 million homes were completed. That leaves a lot of room for more construction growth.
Maybe, over the course of the next couple of years, it will become clear that the neutral number is lower than that. I think it will be closer to 2.6 million than to 1.6 million, but only time will tell.
Directionally, however, I think this should add some confidence about the likely size of the market in construction activity going forward (and in rental unit capacity, since most of the delayed households would be renters under current mortgage regulatory conditions).
To give a more proportional historical sense, Figure 8 shows the completed units and the neutral completed units in terms of percentage growth of the housing stock. A neutral pace of production, using a 5 year rolling average, has been about 1.8%.
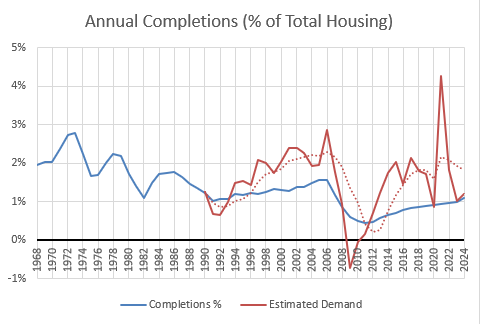
That is my estimate for the construction rate that levels out rent inflation. The formation of more than 10 million households and accumulation of 4 or 5 million vacant units would require new homes in addition to that. So, directionally, the precision of this estimate isn’t particularly important. I would be very surprised if construction does not reach 2.6 million units at some point in the next decade. And, it doesn’t matter a great deal for the economics of new homes for sale constructed in the near future. Projections will improve as data comes in for future activity. Where it is probably most important is the long-term returns on rental units, but even in the out years of Figure 6, on the aggressive projection of construction growth which leads to declining lot premiums, nominal rents would still be increasing, if not as fast as they were before 2022. And, new units will tend to be less sensitive to rent deflation than low-tier existing units.
So, maybe the exact estimate of the current trend isn’t extremely important to current investment decisions, but it will be helpful to get more clarity as this unusual cycle plays out.
In the metro area packages, I preset the neutral construction rate to the rate inferred from completions and lot premium inflation over the last 5 years. Users can choose other neutral estimates if they wish. It is possible, if Trump immigration policies persistently bring down population growth aggressively, that a series of years of negligible population growth will have more of an effect on rent trends than short term changes have had. I generally feel like my crystal ball is pretty clear, but these volatile population trends are unprecedented, so surprises are possible.
The construction gap you identified at 1.6 million units versus 2.6 million neutral completions creates a perfect storm for iBuyers like Opendoor who need inventory flow to operate profitably. Your point about lot premiums continuing to rise despite recnt construction increases suggests pricing power remains elusive for traditional homebuilders, but it also means Opendoor's acquisition costs stay elevated. The cyclical wobbles in rent inflation you describe amplify the risk in their model because they cant accurately predict holding costs. If completions don't reach that 2.6 million threshold within a reasonable timeframe, the margin compression becomes structural rather than cyclical.