October 2023 Erdmann Housing Tracker Update
with notes on inflation and homebuilders
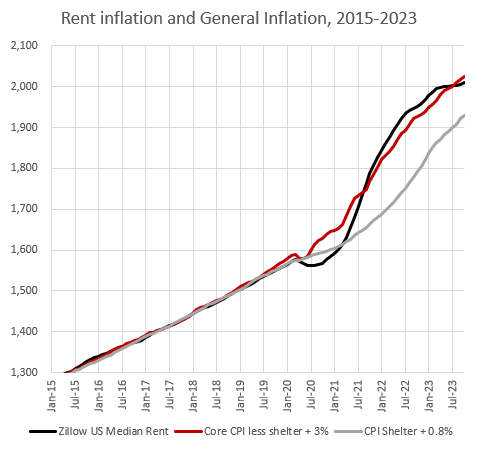
Before getting into the subscriber tracker content, here are this month’s updates on rent and inflation. Last month, I looked at inflation rates, using Zillow rent in place of the CPI shelter component. In short, home prices and rents have basically moved up and down along with general inflation. I think housing insiders are apt to attribute too much of the recent drop in rent trends to supply conditions, when most of it is simply in parallel to the general price level.
Basically, there are 3 components to rent trends:
A persistent 2%+ excess rent inflation from the long-standing supply problem.
Changes in general price levels.
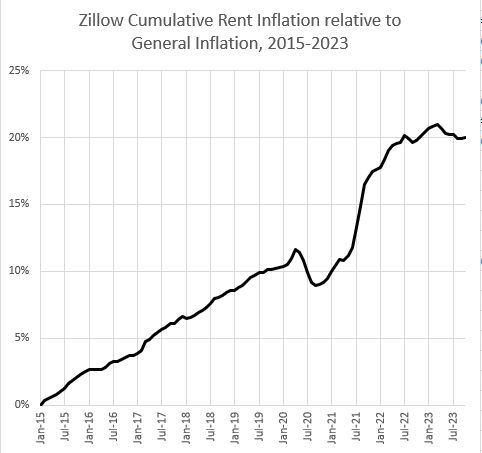
A brief drop in rents immediately after Covid appeared, which was then reversed and overcorrected, which then has roughly reversed back again, so that from 2019 to today, the net change in rents has cumulatively been about the same as it had been from 2015-2019 - general inflation+2.2% annually.
There is a compositional component in the Zillow rent estimate, which seems to generally create about 0.8% in additional rent appreciation in the Zillow ZORI measure, so when I compare the Zillow measure to CPI inflation, Zillow + 3% is 2.2% excess rent inflation + 0.8% compositional adjustment.
You can see each of the 3 trends in the following figures.
You can see in Figure 1 that the Zillow rent estimate ticked back up this month. In Figure 2, on a trailing 12 month basis, Zillow rent is up about 3% and CPI less shelter is up about 2%. The Zillow measure is basically what CPI shelter would be (plus 0.8%) if it wasn’t constructed methodologically with a lag.
In other words, last month, it looked like we might see a new trend of rent disinflation. This month suggests that trends are settling out. Currently, this is better than pre-2020, when Zillow rent tended to be 3% higher than non-shelter CPI, but a correction to deeper rent disinflation has taken a break in this month’s numbers.
You can see that in Figure 3. Last month, it looked like rents relative to general inflation had peaked, and might start to reconverge with long-term general inflation. This month it looks more like the trend might just level out. Better than nothing, but still leaving a lot of work to do.
The implications of this, a discussion of homebuilders, and this month’s Erdmann Housing Tracker numbers are below the fold.
Keep reading with a 7-day free trial
Subscribe to Erdmann Housing Tracker to keep reading this post and get 7 days of free access to the full post archives.


