January 2023 Erdmann Housing Tracker Update
Sorry for being a little delayed this month. There were two data revisions this month. First, I incorporated IRS ZIP code income data for 2020. Since there is a bit of a lag in reported income, I have to infer more recent income trends, so updating the numbers creates some small trend shifts. In 2020, they were larger than normal because Covid federal income supports lead to different trends depending on how you count them.
Second, Zillow, this month, updated its methodology on home price estimates, which created some significant changes.
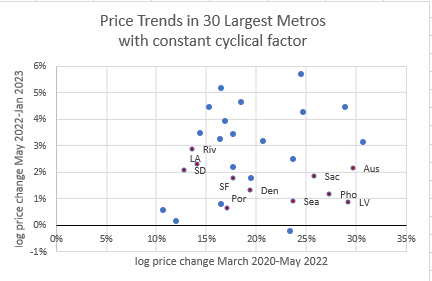
Since I have mentioned it on some free posts, I will note here that the tentative evidence of a supply expectations-driven price correction in California has mostly gone away with the new Zillow price methodology. The y-axis in Figure 1 highlights recent price changes that I attribute to supply conditions. In recent months, California cities have been negative outliers, suggesting the possibility that recent YIMBY gains in California might already be creating downward pressure on home prices. But, in January, after the Zillow revisions, the California cities aren’t outliers anymore, though the western cities generally have lower than average supply-driven price changes. Unfortunately, though, I think we need to cancel the parade for now.
More details on the January update are below the fold.
Keep reading with a 7-day free trial
Subscribe to Erdmann Housing Tracker to keep reading this post and get 7 days of free access to the full post archives.


