
Future Housing Consumption

First, I should clarify a point I made in a previous post. This is a bit in the weeds and probably more of a nerd-out about the particulars of my model than most readers want to bother with. So I am indenting the part that most of you will want to skip.
I like to model the US residential housing market over time as a combination of 2 stable yields - 8% on structures + 3% on land (with cyclical variance that reverts to neutral over time). I was sort of thinking out loud in a recent post, and overstated the case.
In practice, cross-sectionally across a city, low tier homes trade at a higher yield on the structure than high tier homes do. If 8% is the average yield, then maybe the highest tier homes trade at 5% while the lowest tier homes trade at 11%.
Within the confines of my personal model, I can sometimes ignore that. Living near high or low tier homes can also be considered an amenity that flows to the land, making the land less valuable on the low tier home than on the high tier home. So, in terms of thinking about a simple model of home values, mathematically, I could pretend it works either way. But, it is an oversimplification.
I can get away with the simplification at a macro level where I am ignoring the idiosyncratic differences between homes at a given rent level. But homes that rent for, say, $1,000 have a higher yield on average, on the structures themselves, than homes that rent for $2,000. The mortgage crackdown has increased the difference in yields on structures between high tier and low tier homes. So, to account for the effect of the mortgage crackdown, I do need to properly attribute the higher yields on low tier homes to the structures, even within my world of spherical cows that are usually close enough to be substitutes.
And, of course, in the nuts and bolts of property management, there are many considerations to make, regarding the returns on any single property. And, an individual investor underwriting an individual property isn’t thinking about it in these terms at all.
Anyway, a bit in the weeds. I hope that makes sense. If it doesn’t it may not be worth worrying about too much.
tl;dr: The aggregate value of real estate (with some cyclical variation) can be estimated with an unchanging return on structures and on land. Valuations change when rent on land changes, which changes land’s % of the total value. In the earlier post, I asserted that those fixed yields can apply cross-sectionally across a metropolitan area. It is possible, in certain contexts, to pretend that’s the case. But I can’t pretend that’s the case in order to account for the effect of changing mortgage access on valuations across a city. I need to apply different yields to structures across a given city to account for the effects of the mortgage crackdown. In this particular case, the spherical cows don’t substitute. I knew that, but I posted the aggressive assertion before fully editing the ideas in the post.
None of that necessarily is explicitly noted below, but it’s in the background of the model I need to use to work out the expectations I describe below.
OK. So, with that said, what can we expect of future housing consumption?
Table 1 shows rents and prices for a hypothetical home, over time (assuming no income growth or inflation, for simplicity).
I discussed the first 4 columns in the previous post. There was the old normal. Then, the mortgage crackdown lowered home prices, then rents had to increase enough to bring home prices back to an equilibrium with newly constructed homes on new lots. Then, because of supply chain disruptions after Covid and frictions that create a lag in the growth of rental units necessary to supply the new market, rents in some markets have gone past the equilibrium level necessary to trigger new construction on marginal lots.
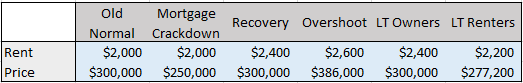
The overshoot is an increase in land rents. The higher valuation is on the lot, so the price premium is much higher, which causes prices to appreciate more than rents. The Closed Access cities (New York, Boston, Los Angeles, and San Francisco) have had lot premiums for a few decades, and those premiums are sustainable because the supply shortage is locally enforced.
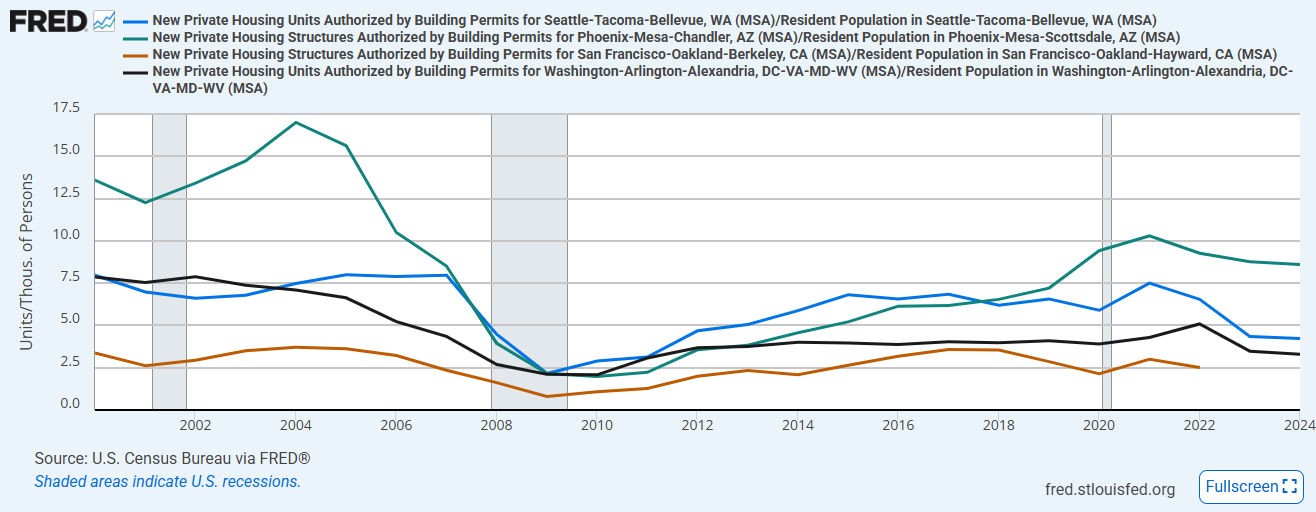
I haven’t been actively updating that list of Closed Access cities because new construction has been down in every city because of the mortgage crackdown and Covid supply chain disruptions, but it may be time to add Washington, DC and Seattle to the list. I think, in both cases, the core cities have been engaged in some positive work to allow more infill development, but construction in the suburbs has been lower. They were both moderately better than the Closed Access cities before 2008. They are less moderately better today. The test will be whether new construction in Seattle and Washington expands as capacity rises over the next few years.
For most other cities, the overshoot is unsustainable. There is ample greenfield space for expansion and numerous exurban municipalities willing to allow sprawl, if nothing else. So, rents and home prices will slowly return to the “recovery” equilibrium.
But, how will that play out?
I think there are 2 stories. One for the 60% of households that are still owners. (It used to be 70%.) Another for the 40% of households that are renters. (It used to be 30%. In fact, it currently is still roughly 30%, with another 10% who have delayed household formation.)
For the owners, in most cities, the long-term will look much like the past. When excess land prices work their way out of the system, the price of homes will still be mostly a product of the cost of lumber, labor, concrete, etc. They will tend to live in homes with the same price and similar size and amenities as they used to, but with higher rental value. Those are the most valuable homes, so they represent more than 60% or 70% of real estate value and new construction.
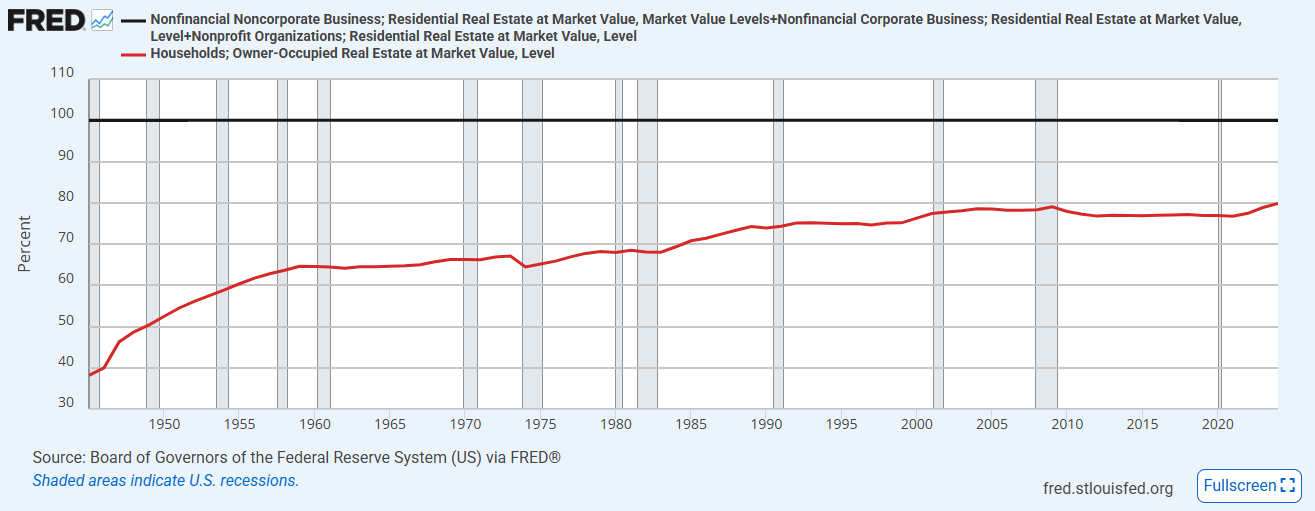
The next few figures demonstrate that. Figure 2 shows the market share over time of existing owned real estate. It has been close to 80% of all residential real estate for some time. By the way, consider this chart when you see people claim that large investors are driving up home prices. Even with the mortgage crackdown, homeowners own a record high portion of all residential real estate, by value.
The most important effect of the mortgage crackdown, so far, has been to stunt the formation of renter households. Renter homeowners, by the way, need someone who is well-funded to buy the home they will live in. That is, by a long shot, the thing we don’t currently have enough of. If you think we have too many of them, I strongly encourage you to do some soul searching about what motivates your economic opinions. It took something much deeper than a factual error to believe we don’t have enough (edit: have too many) well-funded owners of rental housing. Whatever caused you to believe that led you to be wrong, even if it felt morally satisfying.
Currently, 79.8% of the housing stock is owned by owner-occupiers. If you think I’m wrong, or I’m missing something, then what is the right number? How much higher does it need to be than it was at any previous time before you will decide that large investors aren’t the problem? Or, if you think, somehow, getting Wall Street money out of housing will lower the portion of the stock of homes that is owned by families, then, please spell it out for me.
The people that propagate anti-investor sentiment, write about it, and vote for bills against it, aren’t generally reachable, unfortunately. They didn’t come to their position through reason, and they are unlikely to leave it through reason. But, unfortunately, they make a lot of noise. There are honest people out there who might be reachable, and maybe this sort of simple evidence can help them be less worried.
There is a similar pattern in new construction. Figure 3 shows the market share of new single-family homes, in terms of units. In the future, more new single family homes will be rentals. But, in recent history, new multi-family has been almost entirely rentals and new single-family has been almost entirely owner-occupied.
Single-family completions generally ranged around 80% of new units before 2008 and have ranged around 70% of new units since then.
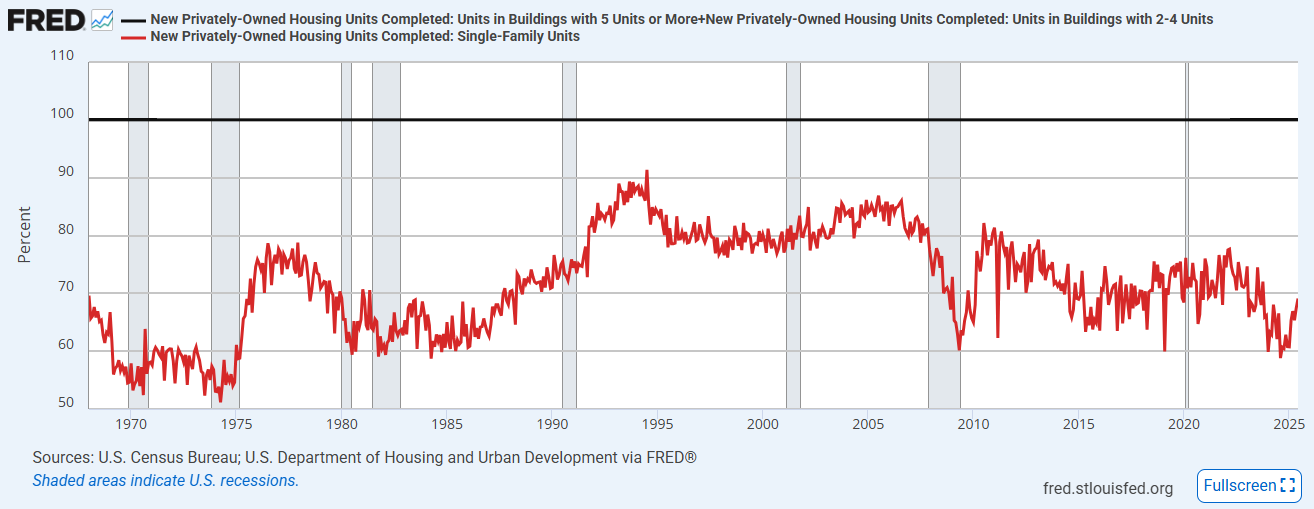
Figure 4 shows market share in terms of dollars. New single-family homes were about 90% of residential investment before 2008 and 80% since then.
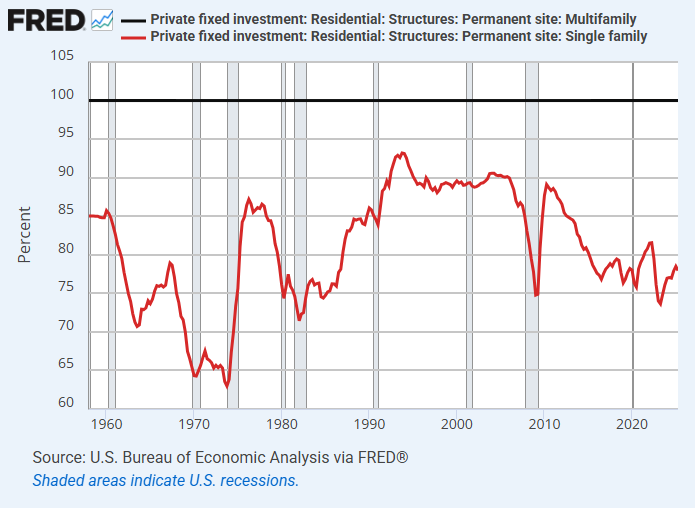
By the way, consider the data in Figures 2, 3, and 4 together. Owner-occupiers own a record high portion of the stock of homes even though single-family homes have been a relatively smaller portion of new construction since 2008. Even with a higher proportion of apartments in the mix compared to 2008, homeowners own a larger share of the housing stock than they ever have before. One reason for that is that, on net, owner-occupiers have been buying existing rental homes where new homes were in short supply.
I’m not sure large investors have even increased their relative market share in recent years, but if they did, it was at the expense of small investor market share. And, most or all of the net growth of large investors in the future will likely be in new units rather than buying existing units.
As renter household formation expands, owner-occupied real estate will probably settle at between 70%-75% of total market value.
In other words, in the long run, the mortgage crackdown will only affect construction activity for about a quarter of the market.
What about the that quarter - the renters? Think of the columns in Table 1 as the story of a single family who has been taking on higher rental expenses because housing demand is sticky downward. They don’t want to trade down into a worse neighborhood in a smaller unit with a longer commute in a different school district, etc. So, they have held on from $2,000 rents to $2,400 rents, or to $2,600 rents if they live in a city that has overshot the long term equilibrium.
Eventually, I think every major market will overshoot to some extent. Then, they will slowly see rents moderate over a period of years until their rent is back to the equivalent of $2,400. That will be rent disinflation for both the family and the unit they are living in.
After that, rent inflation will affect the quantity of housing renters consume, in the very long term. So, the sort of family that used to live in the house with a $2,000 payment, and now live in a house with a $2,400 payment, will eventually live in, say, a house that should rent for $1,800 but instead rents for $2,200.
That is not rent disinflation. That is a change in consumption. Existing units will still be renting for $2,400. But renter families in the future will be living in units that are not as nice or large as they would have in the past.
The correction from overshooting will be a relative loss for existing landlords. The long-term shift in housing consumption will mean less construction. That will be a loss for builders, in terms of quantity. But, really, in the broad scheme of things, we’re talking something like a 10% decline in real consumption by 25% of the market, or a total decline in the long-term real value of residential real estate of 2.5%. Basically one-year’s worth of construction. We’re 10 year’s worth short of units. In terms of the future construction that will happen, it’s a rounding error.
Total residential real estate is worth nearly $60 trillion. If the mortgage crackdown and the Great Recession hadn’t happened, we’d probably have $50 trillion of residential real estate. Instead we have, roughly, $40 trillion that worth $60 trillion because it is 50% inflated.
Residential investment has been running at about $1.2 trillion annually. Roughly speaking, we will need about $10 trillion in additional residential investment over the next decade or two to accommodate recovery of household formation and to reverse inflated household spending on rent. So, let’s say residential real estate is set to grow another $10 trillion as incomes rise, the population grows, etc., and we can use another $10 trillion to return to a pre-2008 level of housing consumption. Call it $60 trillion of real estate, but with value that is no longer inflated relative to 2008.
With the 10% decline in real renter consumption, Americans would demand $57.5 trillion instead of $60 trillion of residential real estate. Over the next 10 or 15 years, that would call for $17.5 trillion of net new construction and net new housing stock instead of $20 trillion. It’s not nothing, but it also doesn’t mean that new rental homes in cities that desperately need them will be unprofitable or that there won’t be demand for more construction.
How will that play out? In every major city, it will look something like Figure 5. The speed and scale at which rents overshoot and the amount of catch-up construction required will differ in each city, but I think this will be a common shape of rents and production moving forward. Cities are somewhere around year 15 or 20 in this process today.
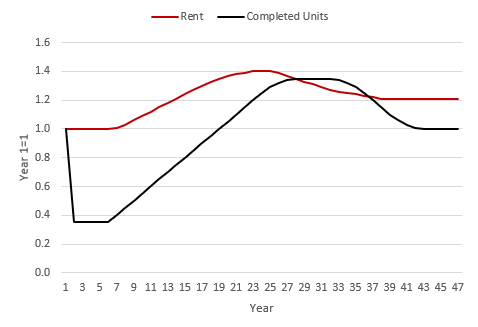
The new renter households will consume somewhat less housing than renter households with similar incomes would have consumed before 2008, but I think that will mostly play out in unit size and quality rather than in the number of units. New households will still want to form. The 26 year-old wants an apartment, even if it’s 1,200 square feet instead of 1,300 square feet.
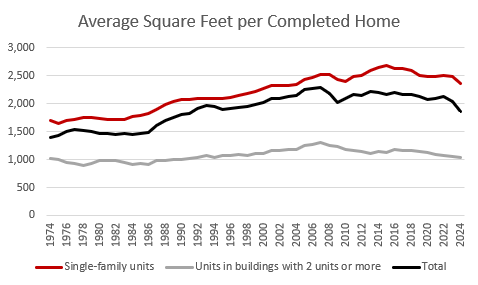
I think we’ve already been seeing this play out. Apartments, which are almost all rentals, have been declining in average size since 2008. Single-family homes have been declining in size since 2015.
Everyone else is going to focus on demographics, family size, zoning, building code constraints, and interest rates. All of those things matter. There are spots here and there on Figure 5 that could be attributed to declining fertility, sharp shifts in interest rates, etc., but I think as purpose-built rentals become a larger portion of new single-family homes, it will be useful to think of the future decline in average unit size as largely a product of rent inflation - the marginal new renter families will be consuming less than they would have as owner-occupiers 20 years ago, because of the mortgage crackdown, which raised equilibrium rents in low tier housing markets.
But they still want their own units. There will still be demand for an additional 15 or 20 million units. They will mostly be a bit smaller, on average.
In summary: The portion of the housing stock owned by owner-occupiers is at a temporary all-time high. As a rental building boom plays out (if we allow it), rents will moderate in cities that have accumulated shortages during the Covid supply disruptions. In the long-term, there will be trillions of dollars of potential new rental housing either constructed or transitioned from owned homes in the existing stock of homes. As long as mortgage standards remain too tight, yields on those rental units will be elevated relative to yields in the past, which means that much of the post-2008 rent inflation will remain. That will reduce real per-capita housing consumption relative to 20th century norms, but even with somewhat reduced consumption, trillions of dollars of new homes will be constructed across all types of cities, where they are legal. Where it is legal, construction will boom.
I'm saddened to hear that DC is in the closed access city list, and a little surprised, but it makes sense on a metro-area level. DC proper is building relatively well compared to the rest of the closed access cities, but the suburbs really haven't been building much. DC has quite a few disinvested neighborhoods (that to begin with weren't single-family zoned) where it was politically feasible to allow new housing construction. The suburbs are mainly single-family zoned and thus highly resistant to new construction.
So Warren Buffett has decided that D.R. Horton and Lennar are good investments. I wonder if he's reading this blog. He will no live to see the full returns on their stock, but I hope his shareholders are appreciative and stay forward looking.