
Do Homebuilders have an inventory problem?

I saw this exchange on Twitter.
One tweeter wrote:
Everyone keeps saying America has a “housing shortage.”
It doesn’t.
Divide total homes by population and you get this (shows chart of homes per capita):
We’ve never had more housing per person than we do right now.
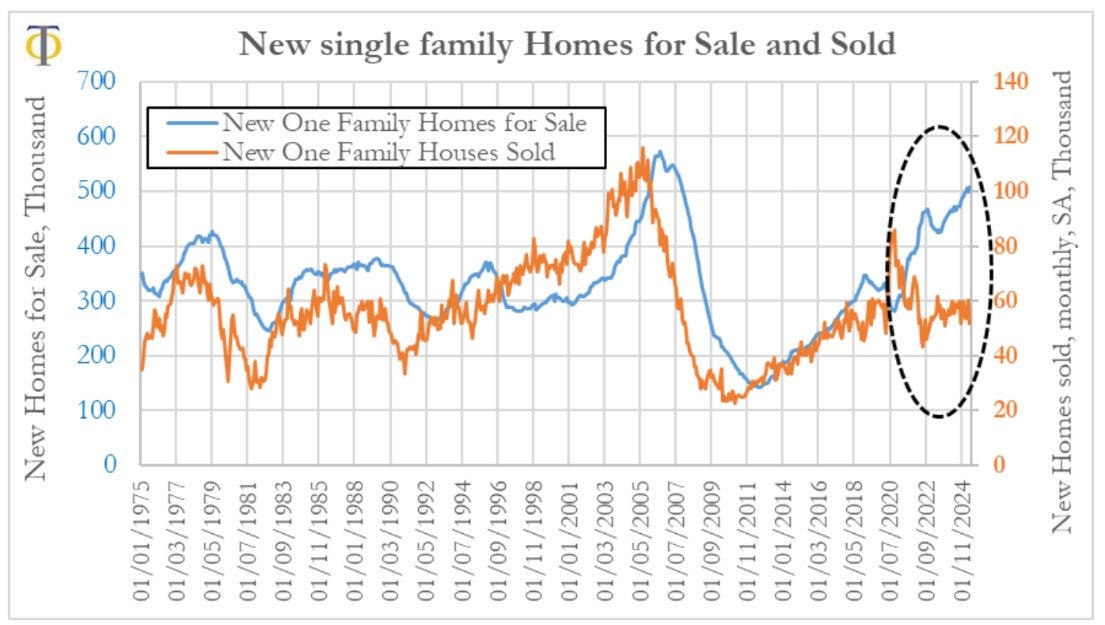
Another tweeter replied with, “Correct. Unprecedented spread between homes for sale and homes sold. Price is only thing that fixes this. Market is frozen.” And he posted this chart.
Here’s another harrowing chart: Months of Supply of New Houses for Sales in the US.
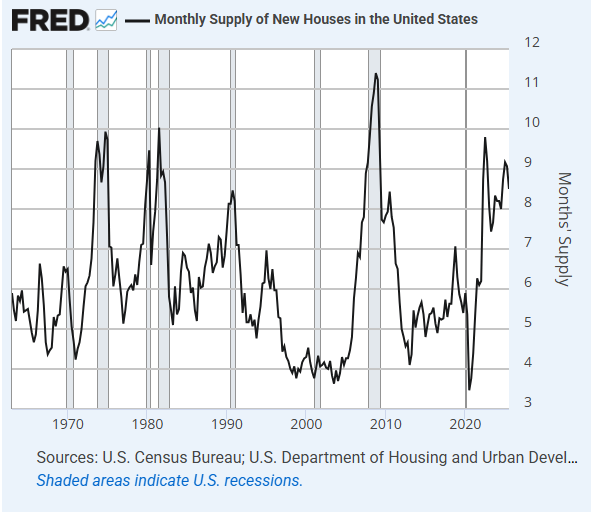
Figure 1 & Figure 2 suggest that homebuilders have been hanging on to a huge amount of excess inventory for more than 3 years, and keep adding more (even worse than before 2008!). Even some smart insider analysts are writing about inventory risk. How could you blame the layman investor, or even a professional asset allocator, for keeping their capital out of this dangerous-looking sector?
I think the evidence is so dangerous-looking that it may be biasing some stock market values down, and providing an investment opportunity. Nothing dangerous is happening.
This relates to my recent posts on household formation and homebuilder earnings.
This post will be a review for frequent readers. But, since the homebuilders are at an interesting turning point, it is probably time for a review.
The first problem is that months of inventory is not a very useful indicator. It doesn’t tell you anything that sales trends haven’t already told you, and it tells you some things that aren’t true.
For instance, the actual number of homes for sale at the peak of months’ of inventory at the end of 2008 was actually lower than the number of homes for sale in 2005 before it started its steep rise. At important inflection points, the “Months of Supply” chart is basically the “Sales trend” chart, upside-down.
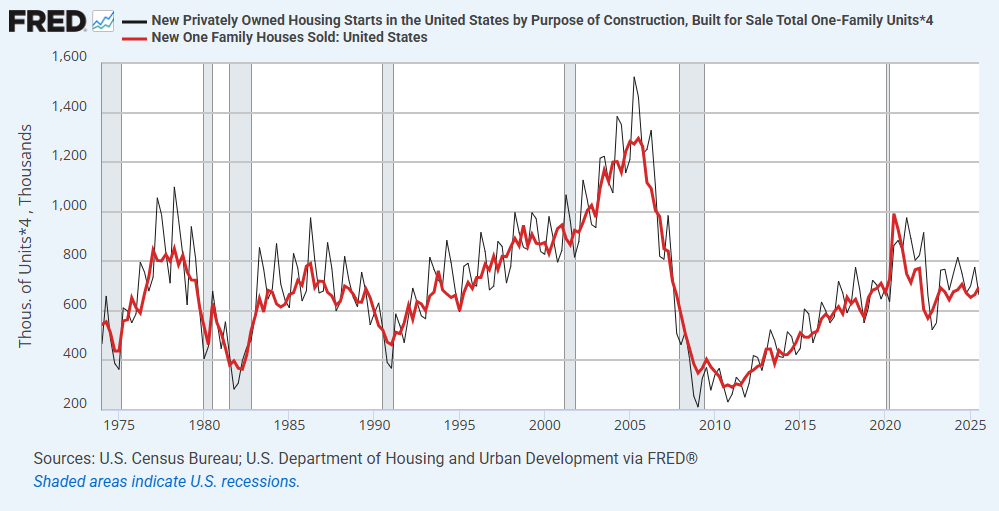
Figure 3 shows single-family homes started for sale and new homes sold. There is little deviation. Building out a community for sale isn’t rocket science. Builders don’t just keep piling empty homes into communities that aren’t selling. You sell a house, you start a house, with some tinkering around the edges. In 2005, when builders were starting and selling homes at an annualized rate of about 1.3 million units, there were 4.2 months of supply (about 450,000 units for sale). By the end of 2008, builders were starting and selling about 300,000 units (annualized), and there were 11.4 months of supply (about 300,000 units for sale).
This created confusion leading up to the 2008 financial crisis. From May to October 2008, as the financial world was falling to tatters, the Fed left their target rate at 2%, on inflation fears. Yes, until October 2008.
As I noted in “Building from the Ground Up”, Fed staff continued to act like further cuts in supply were the key. In the book, I only reported a small snippet of this quote. Going back to the source, it’s worse than I remember. From the August 2008 Fed meeting:
Mr. Wilcox (staff economist): I guess I would push back on the premise that we don’t have a pretty significant adjustment in house prices built into our baseline. We have house prices as measured by OFHEO declining 7 percent this year and another 5 percent in 2009, and I wouldn’t anticipate any rebound in 2010. You know, our ability to measure where that would leave house prices relative to some notion of fair valuation is incredibly imprecise. But one regression-based indicator that we follow suggests that it would have house prices relative to rents swinging from a relatively high valuation to a noticeably low valuation. Charles Fleischman illustrated this yesterday in his pre-FOMC briefing. The major factor that provides some reason for optimism is that construction starts are now low enough that builders are making progress in chipping away their inventory of unsold homes. The months’ supply figures remain extraordinarily high because the denominator is very low; but in terms of units of unsold homes, my recollection is that we’ve chipped away about half the run-up in terms of absolute number of units in inventory. We also have starts continuing to come down materially from their current level. So we think that the process will begin to get inventories into a more normal alignment. (Pages 29-30)
In August 2008, Fed staff thought that the problem with home construction markets was that starts were still elevated, and they were benchmarking to unprecedented further drops in prices, because they thought that there were too many new homes for sale. If they held off on stimulus for just a little bit longer, they thought, housing starts would drop some more, and surely that would get Months of Supply low enough to justify aiming for growth.
And, they even recognize the issue about months of supply being affected by the denominator. And, in their defense, in the decades leading up to the housing boom, inventory had ranged between 300,000 and 400,000 units, and it was still a bit above 400,000 at the time of that meeting. But, especially since they recognized that months of inventory was inflated by low sales, why in the world wouldn’t they think that the best way to “chip away at inventory” would be to aim for higher sales!?
In fact, in every single downturn before 2008, months of supply peaked precisely when new home sales bottomed. Months of supply peaked at the end of 2008. After 2008, new home sales continued to decline, and didn’t permanently rise above the paltry 4th quarter 2008 level until 2013.
I feel embarrassed to write that. My conscience still warns me, “Surely it can’t be true. Make sure not to write something untrue.” Even having studied these events for a decade, and knowing it to be the case, part of me still can’t believe that this was their position. But it was. They were optimistic because housing starts were down to 400,000 units and falling, and they were benchmarking monetary policy to declining home prices while that was the case.
Ironically, there are schools of economic thought who are skeptics and critics of the Fed because centralizing monetary policy will inevitably lead to errors from the Socialist Calculation Problem. And, the vocal members of those schools of thought mostly seem to complain about the Fed being too stimulative by lowering the target rate to zero for all those years that new home sales were below 400,000. “Get me an economist with no hands.”
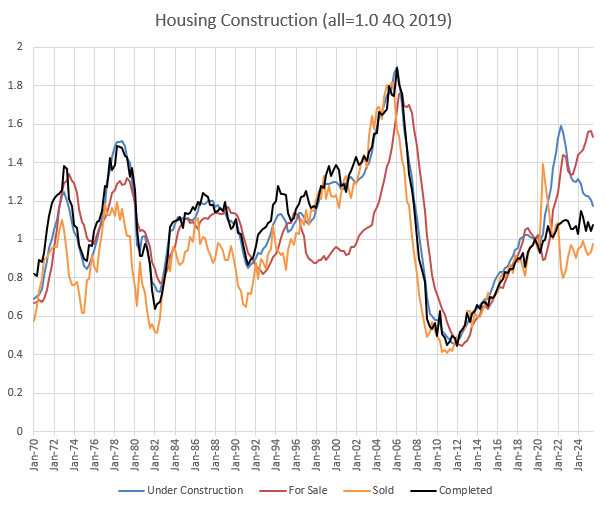
Figure 4 shows homes under construction, for sale, sold, and completed. All are indexed to 2019 to show relative movements over time. Before I get into that, Figure 4 highlights one additional issue with the Fed discussion cited above. Since the 1970s, homes for sale had hovered between 300,000 and 400,000. (On the indexed scale, that’s around 0.9 to 1.2.) So, in mid-2008, when the bottom was falling out, it seemed like inventory of homes for sale was still high. But, as with the trends I discussed in the post from earlier this week, that stable range was an illusion. It had really been an exponential growth trend, growing at a declining rate. But, that wasn’t because population growth had slowed. It was because there was a regional housing shortage.
In the 2000s, when the painful process of moving families out of the Closed Access cities turned into a Contagion city building boom, new home sales were struggling to follow that exponential trend. But, the flat trend in homes for sale was universally treated as the benchmark, and rising new homes sales were treated as oversupply.
But, you can see in Figure 4 that, even in the late 1990s and early 2000s, homes for sale was lagging new home sales significantly. You can see this in Months of Supply in Figure 2. It had traditionally fluctuated around about 6 months, and in the late 1990s and early 2000s, it stayed down around 4 months.
So, there are several spinning plates in the Fed staff’s analysis. If inventory had been at the normal 6 month range in the 1990s and early 2000s, inventory for sale would have been above 400,000 for a full decade, even back to the 1990s before sales started to rise.
And, of course they would have. A country of 300 million is likely to have more new homes for sale than a country of 200 million had 30 years earlier. But, since unusually low inventory in the 1990s created the mirage of a permanently stable inventory level, Fed economists in 2008 weren’t satisfied with the slowdown until inventory was pushed well below what should be a cyclically neutral level. And, the extremely low new home sales they thought would be associated with that low inventory level made “Months of Supply” even more inflated by keeping the denominator too low.
Remaining details below.
