

I happened to be looking at this Mian & Sufi paper from 2014, which is a stark reminder of the blindness of the economics academy coming out of the Great Recession. It mostly just makes me sad to read it.
Here’s the abstract:
We show that deterioration in household balance sheets, what we refer to as the housing net worth channel, played a significant role in the sharp decline in U.S. employment between 2007 and 2009. Using geographical variation across U.S. counties, we show that counties with a larger decline in housing net worth experience a larger decline in non-tradable employment. This result is not driven by industry-specific supply-side shocks, exposure to the construction sector, policy-induced business uncertainty, or contemporaneous credit supply tightening…
This is the issue! The question they sought to answer was the important question to ask. Yes, the loss of housing net worth was probably the most important factor leading to the depth of the economic downturn and unemployment, even beyond construction.
They also note, citing some of their other work, that:
A decline in housing net worth could reduce employment by suppressing consumer demand either through a direct wealth effect or through tighter borrowing constraints driven by the fall in collateral value. Mian, Rao and Sufi (2013) show that households experiencing a decline in housing net worth cut back significantly on spending, with spending cuts per dollar of lost net worth being larger for households in poorer zip codes and zip codes with higher leverage – in line with the predictions of a concave consumption function. The 2007 to 2009 housing bust led to a large decline in housing net worth, and the magnitude of the decline varied greatly across the United States. The cross-sectional variation in the net worth decline depended on (a) the extent of the house price decline in an area, and (b) the amount of leverage on household balance sheets. We use this cross-sectional variation to test if the broader decline in employment is related to the fall in housing net worth.
Yes, the fall in net worth did cause a decline in consumption. And, yes, poor households and more leveraged households were more affected.
But, they attribute that to pre-existing propensities to consume by borrowing from assets like homes and a reaction to over-leverage from the credit boom before 2008. They simply cannot fathom that novel tightening of lending might have caused the loss of wealth by suddenly removing millions of traditional buyers from the market and crashing home prices in a regressive way.
You might think they did consider it, since the abstract says, “This result is not driven by…contemporaneous credit supply tightening.” But they are talking about business credit! They literally don’t account for changing mortgage access.
They analyze the employment and housing market at the county level and they measure differences in employment trends from 2006 to 2009.
This runs into a problem that is common with analysis at the county level and metro area level. Supply constraints lead to rent inflation that is highly correlated with local incomes and mortgage constraints lead to price deflation that is highly correlated with local incomes. So, when either of these effects leads to changes in regional average or median housing trends, it is really just an indirect way of measuring the changes in the poorest neighborhoods of the region.
Some of what they measure as regional differences is just the relative sensitivity of households to mortgage access in different regions. And, a lot of that comes down to what the average regional income was at the time of the mortgage crackdown.
Here are my estimates of deviations from a neutral price/income ratio at the end of each quarter in a typical Atlanta ZIP code with current average income of $50,000 and current average income of $150,000. And, I have added the median credit score on new mortgages, tracked by the New York Fed quarterly.
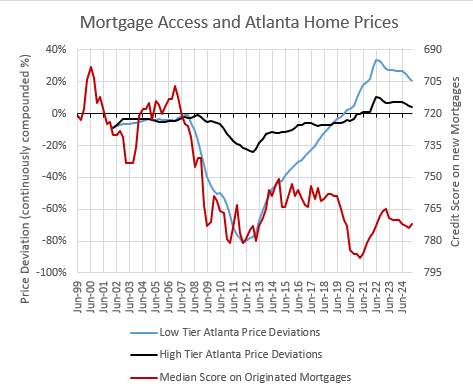
There seems to be some “contemporaneous credit supply tightening” to look at. Tightening that is contemporaneous with low tier home prices and not high tier home prices. Tightening that was associated with this pattern appearing simultaneously across ZIP codes within every urban county, though of course it was deeper in some counties than in others. Tightening which has remained in place, even as prices have rebounded (suggesting that the tightening wasn’t caused by falling prices).
I think, pretty obviously, there is a causality question to ask here, going from novel tightening of mortgage access after 2007 to collapsing home prices, net worth shocks, and local employment trends after 2007.
They concluded that there was an important wealth shock. They concluded that it was an important element in the broader employment contraction. And in a “process of elimination” analysis of the possible causes of the net worth shock, the immediate and permanent elimination of 1/3 of the traditional mortgage market was, apparently, not an issue that they thought was worth looking into. Because, if they thought it was worth looking into, they surely would have decided it was worth commenting on, even if only to explain it away.
That’s what is so sad. We inflicted working class American homeowners with this policy napalm and it didn’t even matter if leading researchers asked the right questions. The right answer to the right question was invisible. There is no discussion. There is an appendix with some additional tests, but it does not include any analysis with additional control variables to consider a causal novel decline in mortgage access. There is nothing to replicate. Just silence. Just pages and pages of discussion about the source of rain from a point of view that is axiomatically uninterested in the existence of clouds, while calling for or being fatalistic about the continuation of a draught.
There are a lot of complicated statistical inferences in the paper. I don’t have any reason to doubt the inferences they made. As in most of these cases, there isn’t necessarily a reason to dismiss the conclusions they come to about the effect of the net worth shock on subsequent employment. But, I think it is like the Mercatus paper I wrote about home prices from 2002 to 2006 and from 2006 to 2010. I actually found more of a price effect from credit access than the existing literature did. But, I was also able to simultaneously measure the price effect of supply constraints.
It’s like the existing literature was an in depth study of a mole hill, and I concluded that the mole hill was even larger than they had thought. And, then I said, “Take a step back from the mole hill and look up.” That’s the supply mountain.
I think that’s what’s going on here. It would be great if they could simply observe the novel change in lending standards so that it could be a part of their conversation.
They noted in the abstract that declining employment was unrelated to the region’s exposure to the construction sector. There is also this footnote:
(T)he change in housing net worth does an excellent job predicting job losses in the construction sector. In unreported results, we find that the change in housing net worth is a stronger predictor of construction job losses than either the share of construction employment as of 2007 or the growth in construction from 2002 to 2007.
I wonder how that could be? What could make net worth loss a better predictor of construction job losses than pre-trend construction activity? Alas, we can only see that which we allow for.
Construction activity didn’t predict the scale of the loss of net worth but the loss of net worth was the best predictor of the scale of the loss of construction employment. In that footnote they asked the right question with shocking specificity. Why would the loss of net worth be an exogenous variable (an outside force with explanatory power) for construction employment? And yet…
If I read the paper as generously as possible, it’s possible they ignored the mortgage crackdown because they would have considered it difficult to establish causation from mortgage tightening to wealth shock because even stable lending standards might be associated with a decline in lending to more credit constrained households when homes are losing value.
But, they didn’t then proceed with humility. They proceeded with an unspoken presumption that tightened lending wasn’t a causal factor - a presumption treated as a certainty through silence. How can you be humble about the things you don’t know you don’t know?
And that goes to the deeper problem of treating the collapse - whatever scale it might take - as an inevitable consequence of activities that had taken place years earlier.
Along the lines of my post yesterday, what exactly is the demand elasticity that causes low tier homes to lose more than half their value in low tier Atlanta in 2008? What’s the trigger for that, if not a novel tightening of credit? At what point does the scale of the downturn demand more rigorous analysis of its potential causes? At what point does the scale of the downturn call for asking “Did this really need to happen?” before asking “What problems will be downstream of this?” At what point should we stop focusing on pre-existing excesses and start focusing on stopping the collapse?
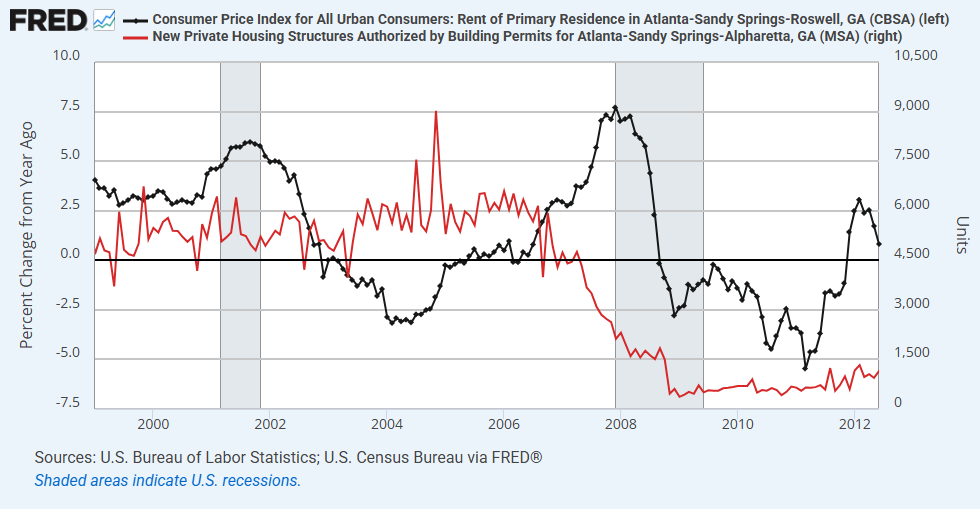
As I mentioned in the previous post, it actually isn’t coherent to ask what the elasticity of demand would need to be to make home prices decline as much as they did in Atlanta. It isn’t coherent because there was no measurable spike in supply in Atlanta. In fact, rental vacancies had peaked in Atlanta by 2004. Then, by 2006, construction of new homes was already declining. And, in 2006 and 2007, rent inflation started increasing (Figure 2, black) in Atlanta while vacancies and construction (Figure 2, red) were declining.
What counternarrative even comes close to the mortgage crackdown to explain the causality of the price collapse after 2007 in Figure 1?
A plausible alternative reading of the Mian and Sufi data would be, “How much unemployment did the mortgage crackdown cause?” Will anyone who can get published in the academic journals ever write that paper? How many economists, to this day, even know that it’s a legitimate question?
A while back, I looked into writing a retrospective on Mian and Sufi’s influential book for lay audiences, “House of Debt”, and what struck me upon picking it up again was that, really, only a small portion of the book was about the pre-2008 lending boom. Most of the book, like this paper, was about the aftermath - the damage done by a wealth shock. And the details about the lending boom were really just a pretext for writing the parts about the collapse with the presumption that it was all fated. Every bad thing was presumptively the consequence of something that had happened in 2006. So, in most of the book, the most important words are the words not written. “Why not counter the wealth shock?”
Of course, now, with hindsight, we know that, even with all the policy choices that did lower real estate home values, the market over the long-term made the wealth loss temporary. Reality reversed the wealth shock even if economists couldn’t imagine that it was a disequilibrium.
Figure 3 shows the average price/rent ratio (blue) in Atlanta and Atlanta rent inflation relative to general inflation (red). Both are indexed to 100 in September 2003, which is roughly the beginning of the subprime boom.
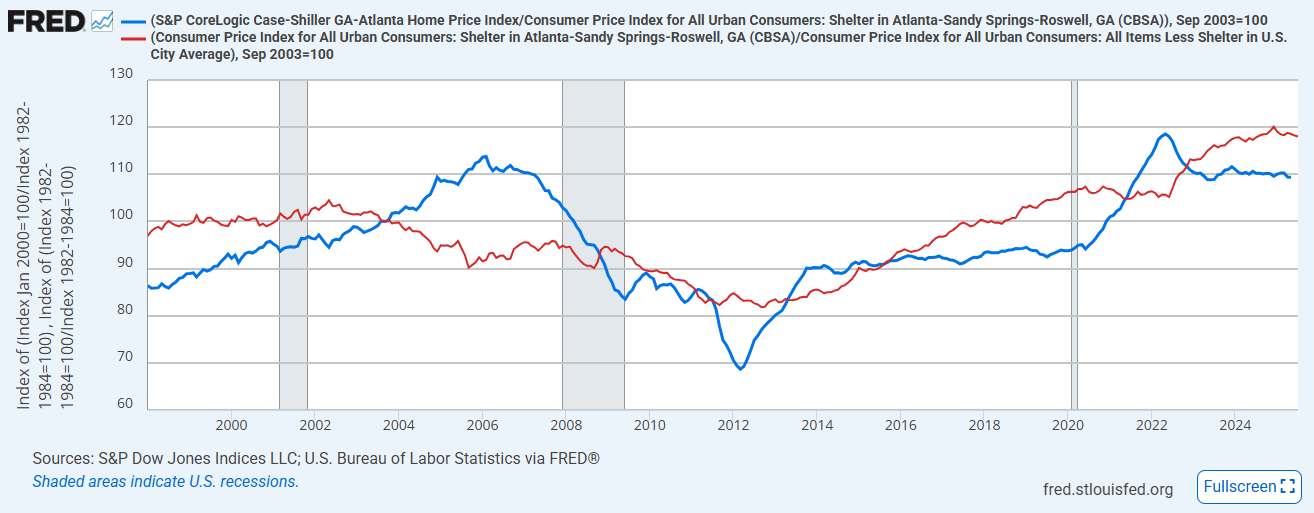
There are several distinct phases here. Most importantly, for this post:
During the lending boom from 2003 to 2006, rents declined, and Atlanta price/rent ratios increased mostly because of declining rents. That is a good thing. That is a progressively improving cost of living, driven by private investment.
From 2007 to 2012, prices dropped sharply because of the mortgage crackdown. And, the mortgage crackdown had such a deep effect on Americans’ ability to consume housing, it also led to declining rents. But, prices declined much more steeply than rents, leading to very low price/rent ratios.
(I’ll look more comprehensively at these measures in the next post.) I often point out that the bust wasn’t really a mirror of the boom. Most of the price appreciation in the boom was among low-tier housing in the house-poor coastal metropolitan areas. Most of the price depreciation was among low-tier housing in the rest of the country where there hadn’t been a price bubble or an unusual construction boom.
Here, we can see that, even within a city like Atlanta, the bust wasn’t a mirror of the boom. The boom involved declining real rents and moderate real prices (leading to somewhat rising price/rent ratios). Those reversed somewhat during the early contraction leading up to 2008. As construction declined, rents started to rise and prices started to fall. The bust after the mortgage crackdown involved both declining rents and deeply declining prices.
In any case, why would Atlanta want the bust to be a mirror of the boom - rising rents and declining prices? Who would that serve? High costs and low asset prices is a characteristic of less developed economies.
The details Mian and Sufi discuss and the things they leave unsaid imply that moderating rents from 2003 to 2006 were unsustainable and harmful and that the collapse in wealth and employment from 2006 to 2009 was inevitable. I think that’s tragic. And I especially think it’s tragic that a consensus developed around that implication by osmosis - a collective error of omission - with little or no public or academic discussion or doubt.
I am thoroughly persuaded by your work on the issue of the mortgage crackdown, but I don't remember reading if you have identified any specific "smoking guns" that explain the shift. Do you know of any new explicit policy(ies) that have explanatory value or has the crackdown been more of a downstream effect of the generalized moral panic that took hold? Put differently, do you see the mortgage crackdown as a straightforward regulatory story or a messier, sociological one (if such a distinction can even be made)?