April 2024 Erdmann Housing Tracker Update
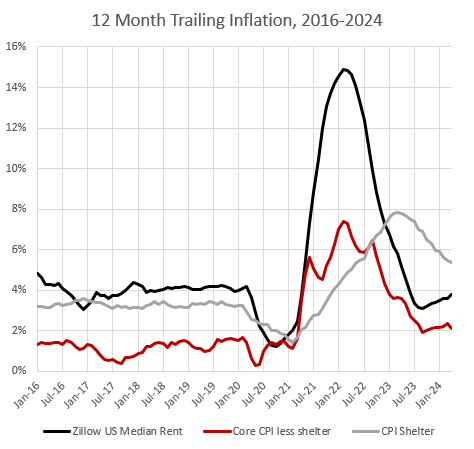
Trends continue along the path I discussed in the recent post about inflation. Non-shelter core CPI inflation continues to track about 2% while CPI shelter inflation continues its lagged decline from the 2022 highs. An estimate of rent inflation, using Zillow rent estimates, had declined to approximately 3%, but now is trending back to 4% or 5%.
As Figure 1 shows, the 2% pre-Covid CPI inflation trend was really an average of shelter inflation over 3% and non-shelter inflation that was just above 1%. In the post-Covid recovery period, both categories are about 1% higher than they were before Covid. I would exclude shelter inflation from monetary policy considerations, so I consider this to be in line with a 2% inflation target. Everyone else, it seems, considers it too high.
It doesn’t necessarily matter that much. I think the current trend is compatible with 5% NGDP growth, consisting of 3% real growth and 2% inflation. If the Fed tightens from here, carefully, which is basically what they have been doing, then it might be possible that CPI inflation, including shelter, that is closer to 2%, will be associated with 4% NGDP growth that will consist of 3% real growth and 1% GDP inflation. (Rent is a smaller portion of the GDP price index than it is of the core CPI price index.)
Ironically, slower NGDP growth will be associated with lower interest rates. So, when elevated rent inflation continues to push up housing costs after tight Fed policy lowers nominal growth, the hordes of folks who have everything wrong about housing will think they are vindicated, because they will be able to squint enough to attribute the continuation of high home prices to the reduction in mortgage rates.
If our hero, JPow!, can continue to keep the nominal economy moving along a 4-5% growth path with inflation of 2% or less, the demand-siders and bubble-mongers will continue to have to look for new reasons why housing is still a bubble market. They will, unfortunately, point to corporate purchasing activity and ownership. If policymakers move to ban or greatly limit corporate homeownership, the human tragedy in our cities will continue to accumulate.
Figure 2 shows the accumulation of excess rent inflation since 2015. As you can see, after a couple of wiggles through the Covid period, we are right back on the pre-Covid exponential trend. This month, Zillow’s estimate for US rent took a little bit of a breather, but in general over the past few months, it has been hot. The implication is that current rates of new home construction are not high enough to bend the curve on rent inflation.
The same can be said of home prices. Figure 3 charts rents since 2015, and aligns home prices with rents from 2015 to 2019. Again, after a couple of wiggles, the price trend has sidled right back up to the rent trend.
So, there is a persistent problem of excess rent inflation. After accounting for that, rising rents during and after Covid are entirely explained by trends in general inflation. And rising home prices are entirely explained by general inflation and rent.
Notice I didn’t mention interest rates.
Updates on tracker data under the paywall.
Keep reading with a 7-day free trial
Subscribe to Erdmann Housing Tracker to keep reading this post and get 7 days of free access to the full post archives.


