Why the Economy Isn't Working, Addendum
Earlier, I posted an update on incomes and incomes after rent, in which Zillow and IRS data tell a tale of regressive stagnation.
In that post, I analyzed the period from 2015-2022 because that’s when we have both rent and income data at the ZIP code level.
I should have added a hopeful note. We have rent data up to the present, because of Zillow. And, there is income data available, just not at the ZIP code level. But, since incomes generally rise at relatively similar rates, and it is the asymmetries in rent inflation that drive this story, I can estimate these measures for the 2015-2024 period with relative accuracy.
First, a quick change on the 2015-2022 numbers. I adjusted for inflation in the previous post using the GDP deflator, but I think the better way to adjust for inflation, given the question I’m trying to answer is CPI excluding Shelter. It’s not a big change, but it does bump the “income growth after rent” number for the bottom income quintile up from -1.9% to +0.2%.
Figure 1 shows the changes from 2015-2022 with the CPI deflator.
Figure 2, which was in the previous post, does show some moderation in the trend. Rents are still rising more than general inflation, but not as much as they were, and not as regressively. And, wages have been rising at a relatively healthy clip.
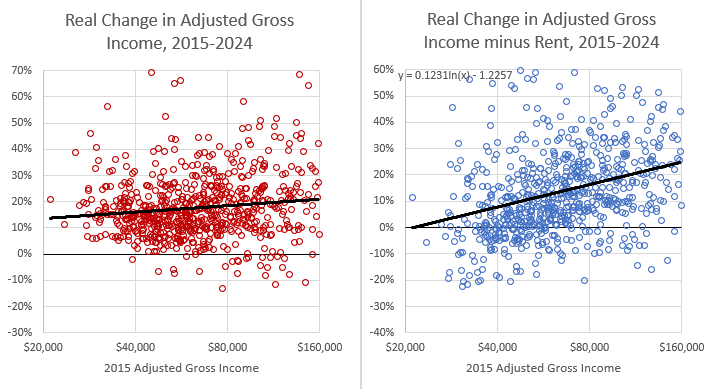
Those 2 factors have combined to improve conditions a lot in 2 years. National per capita income reportedly increased by 9.7% from 2022 to 2024. Here, I estimated 2024 incomes by adding 9.7% to each ZIP code’s 2022 income. It isn’t reversing the previous regressive decade, but at least it has stopped. And growth has been shared across the income distribution.
From 2015-2022, real incomes after rent in the bottom income quintile increased 0.2%. From 2015-2024, they increased 6.6%.
With a building boom, we should be able to reverse the regressive rent inflation and flatten the line of real income after rent for the years 2015-2028 or 2015-2030.
In the meantime, I was remiss to leave out the positive postscript.


The rent-adjusted income lens is exactly what’s missing from mainstream discourse—appreciate this data-driven clarity on how housing is quietly shaping inequality
Great series of posts. I think that the left shares a greater portion of the blame for the active obstruction and abuse of property developers. This attitude has deep roots in the environmentalist movements of the 60's and 70's. That NEPA is a product of the Nixon administration demonstrates the strange alliances that are made in American politics. A deep irony is that if the Trump administration succeeds in gutting the more onerous parts of environmental reviews it will serve as a rallying point for political pushback in blue states. A possible counterweight is left-wing/New Urbanism, but we're adept at shooting ourselves in the foot at every opportunity.