We're all below average (except for Austin)
At the end of my Liberal Currents piece, I wrote, “Before 2008, even at the bottom of our deepest recessions, America never produced fewer new homes per capita than we produce today.”
And, I wrote about how a city with just moderate growth of - say 1% annual population growth - would need to permit about 6 units per thousand residents, and that growing cities usually permit more than 10 units.
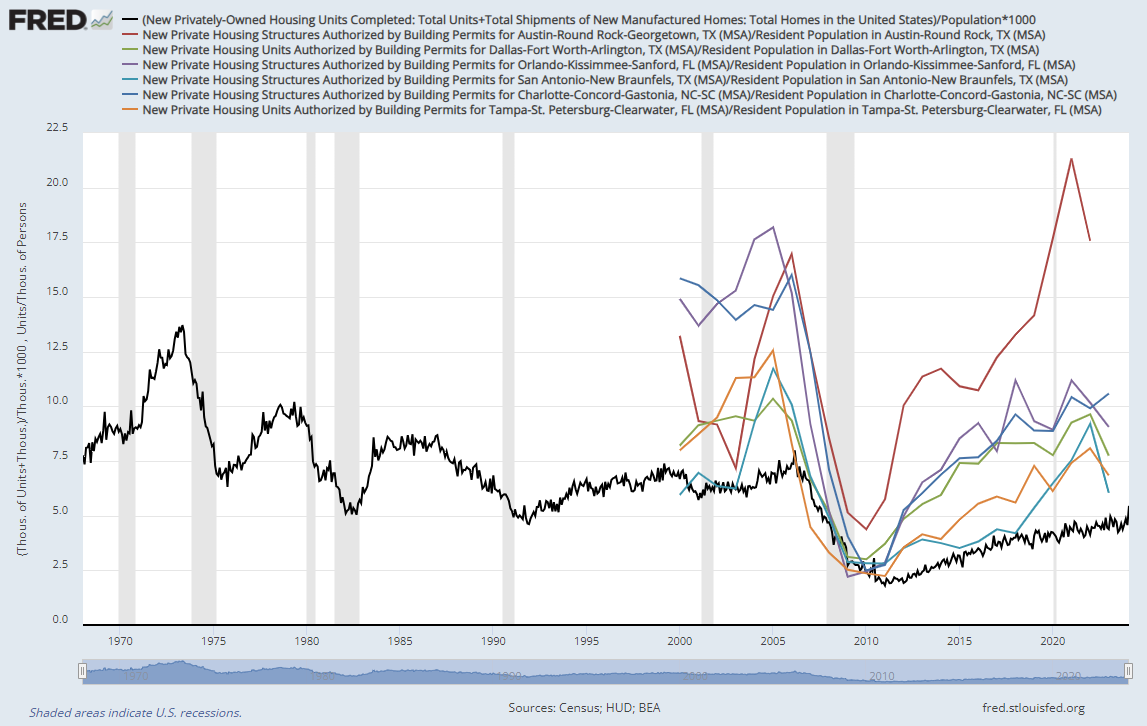
To put that into perspective, here is a chart of per capita new housing over time in the US and per capita new housing in the US cities that are currently growing the fastest.
In the early 1970s, national housing construction was above 10 units per thousand for several years!
Austin is the only major metropolitan area that would have been above average in the early 1970s!
Here are vacancy rates - rental (blue), for sale (red), and total (black). Note, I haven’t delved deeply into the details, but I think some of the rise in vacancy rates in the mid-1980s is from methodological changes.
When the average city was building like Austin, vacancy rates were low and stable. At the macro-level, ample building doesn’t leave us with a bunch of empty homes. It lowers rents.


