We need empty houses
Just a quick visualization today.
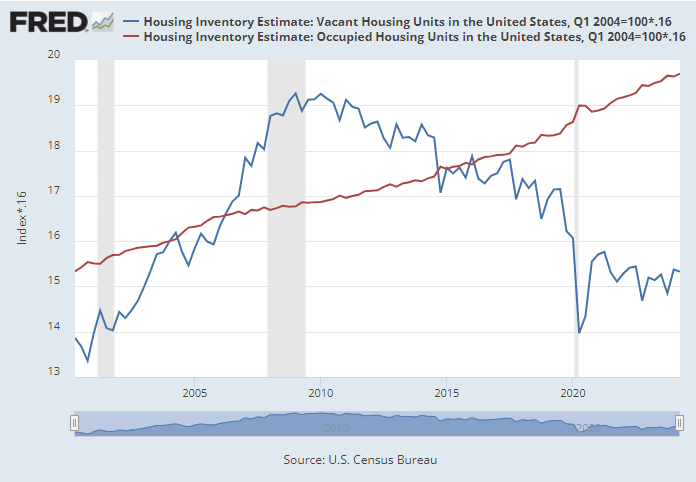
In Figure 1, I show the number of vacant homes and the number of occupied homes in the US. I have indexed them so that, roughly, when the number of vacancies is relatively higher than the number of occupied units - when the blue line is above the red line - rent inflation was stable or declining. When the blue line is below the red line, rent inflation has been rising faster than general inflation.
Then, I scaled the y-axis so that it is equal to the number of vacant homes today, in millions. In other words, the blue line today is at about 15, and there are about 15 million vacant homes today (including units for sale or rent, under renovation, seasonally used, etc.).
Since at least the mid-1990s, rent inflation, on average, in the US, has been excessive - rising faster than the general price level. Around 2005, construction activity briefly was high enough to expand supply and moderately increase vacancies so that average rents, briefly, stopped rising substantially faster than the prices of other goods and services.
In all the chaos of the crisis, demand collapsed, vacancies increased, and rents were relatively stable for a few years after the crisis. For the 16 years since then, we have been underbuilding, poaching vacant units to bridge the gap between building and rising demand, and by 2015, rent inflation again rose above general inflation. In fact, the past decade has seen an unprecedented amount of excess rent inflation.
So, these two measures are set to be roughly equal around 2005. From then, they would rise proportionately if the vacancy rate remained stable. The vacancy rate was about 13% from 2004 to 2006. Today it’s about 10%. If it had remained 13%, the blue line would have risen in line with the red line.
Economists with trade groups/government agencies/think tanks, etc. today will say that we need anywhere from 1 to 5 million new homes.
As you can see, if there is no increase in housing occupancy - no household formation, etc. - it would take 5 million empty homes just to get back to a neutral housing market associated with stable rents.
The conventional estimates of the housing shortage are ridiculously low. The problem is so bad that it would risk your reputation to truthfully assess it. So nobody does.
Situations like this are where an investor can earn higher returns by buying securities where the truthful assessment of their value would risk your reputation. But, unfortunately, in policy matters, we can’t just bet against policymakers. Policymakers have to be convinced of the unspeakable truths.
We need at least 15 million homes in order to return to sharing the benefits of the American experiment with the working class. 5 million of them will be empty. And that will be a necessary part of the healing.


Presumably the new 5 million vacant homes would be mostly older existing homes that become vacant with the new ones replacing them.
For the argument you are making here, do you care about causation vs correlation?
To illustrate: when I lived in Sydney I heard that, when you bought a rental property on a mortgage and it's currently not occupied, you can count the mortgage payments as a loss to offset your income from other sources.
If you changed that law, so that mortgage payments can't be deducted from your income tax for empty properties, ceteris paribus you would presumably see fewer vacancies and lower rents.
But the overall background trend you observe in your post would probably still apply.
(Btw, I am not 100% sure about that law in New South Wales. If I'm wrong, just take it as a hypothetical example.)