November 2022 Erdmann Housing Tracker Update
The trends of the past few months have shifted a bit. The signs of supply relief in California took a bit of a rest this month and the marginal cyclical downturn in the West generally continued, although as you can see in the charts, the cumulative May-November changes look basically the same as the post-May changes have looked for the past couple of months. The cyclical reversal in Austin continues to deepen, but Austin is basically alone among the 30 largest metros.
Figure 1 is the scatterplot of price trends during Covid (x-axis) compared to recent months (y-axis).
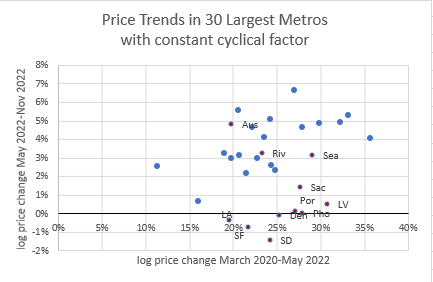
Figure 2 shows trends with the supply component fixed, so that cyclical trends are isolated. (All of these scatterplots include price changes proportional to income growth, so a metro with zero cyclical and supply driven price changes would still have a positive number. So, for instance, San Francisco income growth is estimated at 5%, with roughly 6% declines each from supply and cycle effects, leading to about a 7% price decline (5-6-6) and about 1% each for the price changes with a component fixed (5-6). Austin, on the other hand, since May, has had an estimated 5% income growth, roughly stable supply effects, and a 12% cyclical reversal. So, on the charts, on the y-axis, it comes out to about -6 or -7% in total changes and changes with a fixed supply factor (5-12) and to about +5% with a fixed cyclical factor (5-0).)
Figure 3 shows trends with the cyclical component fixed, so that supply trends are isolated.
As has been the case for a few months, Austin is an extreme outlier having had a stronger cyclical boom which is now reversing. The western cities in general have had a cyclical rest, but not much of a reversal. The western cities, and especially the coastal California metros, have also had a rest in supply driven price appreciation while the rest of the country continues to remain constrained.
According to Zillow data, there is a cyclical pause in home prices, but a relatively benign one for the most part, which doesn’t need to be associated with damaging nominal price collapses across the country.
CPI numbers today confirm that now we have 5 full months of negligible consumer price growth excluding the CPI shelter component (which is mostly composed of a rent measure that tends to lag market asking rents). With each additional month, inflation fears should recede. Immediately, this morning, the homebuilder stocks and the broader market moved higher, because this points to lower interest rates, but my position is that interest rates are overrated as a housing market indicator. Lower inflation is good, but we need the Fed to reverse course fast enough to avoid recession, and lower inflation means the reversal needs to come faster. Rates are likely to decline in any case. The more tardy the Fed is, the lower they will be. Lower will not be better. The low inflation numbers are good, but the good news is contingent on future nominal trends. The move from 6% mortgage rates to 4% rates from 2008 to 2012 was not bullish, by a long shot.
Updated national numbers below the fold for paid subscribers. “Founding member” subscribers have received an e-mailed file with prices for total price changes (attributed to cyclical, supply constraint, and credit constraint factors) for 30 major metropolitan areas.
(Here is a post describing the tracker.)
Keep reading with a 7-day free trial
Subscribe to Erdmann Housing Tracker to keep reading this post and get 7 days of free access to the full post archives.


