
No, this isn't normal

There are a surprising number of supply skeptics that put effort into their position. I’m not sure what their motivations are in every case. But, for those who want to oppose city-building, there are enough of them, with credentials of some sort, to provide them with claims to cite. Among these sources, there is quite a bit of sophistry.
One thing I see thrown out there, now and then, is the idea that cities have always been expensive, and that this is much ado about nothing. It’s a weird thing to claim. For instance, less than 20 years ago, we wiped out our entire economy because we freaked out about housing costs. Everyone has seen that Case-Shiller chart showing low and steady home prices for decades or centuries before they suddenly shot up in the last 30 years.
I take issue a lot with housing pundits that take a demand-side approach. Folks that don’t think tightened lending standards after 2008 are important, who think that Fed policy, or interest rates, or federal subsidies are to blame for high housing costs. Or, they’ll note that houses have gotten larger, families smaller, etc. I’m not going to take the space here to explain what’s wrong with all those points.
I think, generally, those folks have Gish Galloped themselves. Over a period of years or decades, they have gathered a collection of explanations for high home prices which are all plausible at some level. They are all mostly wrong but a little bit right. And, once they have jogged far enough down the path that those explanations led them, they can’t see the truth from where they have ended up. They are sincerely approaching the topic, and there are just too many knots for them to untie to put everything into a proper scale. There are too many errors for them to walk back. It’s a tough intellectual challenge for anyone in that position. Some can. Everyone is somewhere on a spectrum where their prior probabilities are too strong to move their conclusions or weak enough that they can.
There is another path that leads people astray, which is blaming high housing costs on the agglomeration economies of urban centers. People will pay more to live in productive or attractive places, and so those places will develop until the marginal new housing is more expensive. Incomes and costs will rise in those places over time. That is another real thing that happens. And, in this case it is completely true, but it just doesn’t explain much of what’s happened over the last 30 years. But, again, at least it’s a sincere and plausible explanation at some level.
The sophists on the other hand, will sometimes claim that there just isn’t a housing cost problem. The Case-Shiller chart just doesn’t exist. The problem that those above are writing countless misdirected words about isn’t even a problem.
One claim I’ve seen from some of the sophists is that we don’t have a housing crisis because rent inflation hasn’t risen any faster than incomes have. I think this is sort drawing on the agglomeration literature. The idea is that people will bid up the price of well-located real estate until it has sucked up all the benefits of moving to cities that are “full”.
There are a few things to say about that.
First, that’s a pretty strong form of the agglomeration story. It presumes that every expensive city is basically at maximum capacity, when clearly this is a local political choice, and not really even a local choice that has been made in unison but more of a collective action problem. And it presumes that once that condition is in place, every penny of utility goes to land.
Second, our most expensive cities are actually worse than that. The average resident is worse off than residents of other places, and they aren’t butting up against geographical barriers that make growth expensive. They are actually shrinking.
Third, the agglomeration story says that higher rents might claim some of the additional income households can claim by moving to a preferred location, but it doesn’t say that rents will rise everywhere at the rate of nominal income growth, even across time.
Henry George had a theory about that concerning land, in the 19th Century. And in earlier times where most wealth was tied to land, it might have sort of been true about some places, since the supply of land is fixed. But, it isn’t true of housing. It has never been true of structures. There is no fixed supply of structures.
If every consumption item did that, real incomes would never rise.
The fact that rent inflation has nearly equaled nominal income growth for 25 years is the sign that something really odd and really new is going on.
Figure 1 shows nominal per capita income growth since 2000. It also shows cumulative general inflation over that period and cumulative rent inflation.
Since 2001, rent inflation and income have grown at almost exactly the same rate. The fit is so tight, it is easy to see why a layman might be fooled by one of the sophists into thinking it’s supposed to work that way.
General inflation (green) has been quite a bit below that. So, basically, the way to read this chart is that the green line shows how much prices have risen. The difference between the green line and the blue line is how many more goods and services we can afford after accounting for rising prices. That’s about 30% growth since 2001.

However, when it comes to housing, there has been negligible growth. On average, if people wanted to improve their housing as their real incomes grew 30%, they had to spend more of their incomes on it and less of their incomes on other things in order to do it.
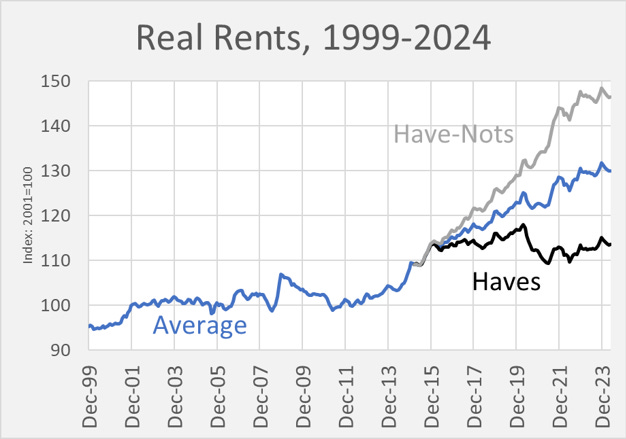
This hasn’t been equally felt by all families. It has been highly regressive. Figure 2 shows real rent inflation since 1999 - how much rent inflation has outpaced non-rent inflation. And, here, using Zillow data, since 2015, I divided it into rents of the richest and poorest ZIP codes. (I think I used the highest and lowest quintiles.)
In the richest ZIP codes, rents have been neutral - rising at about the rate of general inflation. In the poorest ZIP codes, rents have risen nearly 40% more than general inflation.
Basically, families that can still qualify for mortgages or can buy with cash have been proceeding along as normal. Incomes are rising, and as they rise, they consume more goods and services of many kinds - including housing.
Families that can’t qualify for mortgages have experienced rent inflation much higher than their income growth. They have had to spend more of their incomes on housing and spend less on other goods and services, just to keep the house and location they had. Since 2015, the average household in the lowest income quintile has plausibly lost real income because all their income gains have gone to rent.
Keep in mind, too, this isn’t just about urban agglomeration economies. This is rent inflation for the whole country.
Figure 3 shows how it is supposed to work, and how, in spite of the nonsense you might hear from the sophists, it has worked always and everywhere, outside of small idiosyncratic exceptions.
Figure 3 is the same as Figure 1, but it is for the period 1949 to the late 1990s. During that period, rent inflation actually was lower than general inflation.
It was easier to build houses then, so we built them at roughly the rate that our real incomes were increasing. Actually, because of post-New Deal advances in public finance, we built new homes at a slightly higher pace than our real incomes were growing - enough to lower rent inflation.

Figure 1 is really weird. Tragic. A disease. It has to be fixed.
Between the NIMBYs, the sophists, and the misdirected souls, it’s going to take a great supermajority of the rest of us to make the change happen. The problem is bad enough that a supermajority is possible.
But, for the love of Pete, don’t let anyone convince you that we are anywhere close to normal, let alone acceptable.
Bonus Chart showing the whole period from 1947 to the present:
Blue is per capita income adjusted with general CPI inflation excluding shelter. Black is per capita income adjusted with CPI inflation for tenant rentals. Red is per capita income adjusted with general CPI inflation.

All those “What Happened in 1971?” charts you see about why wages didn’t keep up with productivity? Rent inflation is responsible for a pretty big chunk of it.
On the one hand, few people spend 100% of their incomes on rent. On the other hand, as I mentioned, the housing shortage creates systematically regressive rent inflation, so rent inflation has actually been higher for poorer families in general, and poorer families tend to spend more of their incomes on rent - frequently more than 30% and sometimes even more than half. So, for some families, the housing shortage really has meant relatively flat real incomes since 2000.
The differences between Figure 1 & Figure 3 are really aggravating because it demonstrates how an entire nation has lost its way on residential real estate. I think it's somewhat fair to say that zoning regulations snuck up on us when it comes to analysis of cause and effect. During the 70's, 80's, and 90's someone like Chip Case could marvel at how his house in the Boston suburbs was increasing in value and correctly ascribe it to demand. He could look at flat or declining property values in downtown and high density suburbs close to the city core to prove his point. The regulatory choices that had been made---with continuing broad support by voters---has in some ways destroyed the supply of land. Peripheral suburbs that have 2 acre lot size minimums for single family homes and other prohibitions on all forms of development throttle urban evolution.
Nice. May I suggest putting Figures 1&3 into a single timeline so you can see where rent inflation starting going wrong?