
More housing supply shouldn't bring prices down.

Lately, this sort of chart has been a popular citation for housing supply advocates. And it should be. But I think there are some subtle things going on here that we should approach with care.
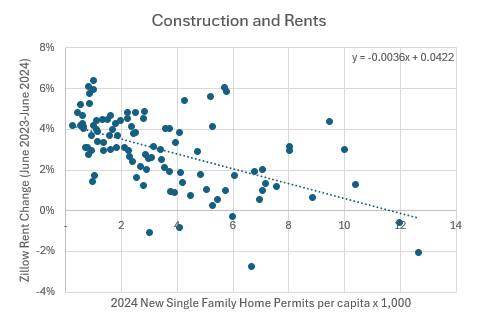
Figure 1 shows single-family permitting rates and the one-year change in rents. This is the largest 92 metro areas that don’t have a functionally vertical supply curve (NYC, LA, San Francisco, etc. are excluded).
I want to make a few points here.
Whether it is single-family or multi-family, this is probably a pretty accurate picture of the typical effect of new housing on rents, all else equal - a decrease of 1.5% for each 4 units per 1,000 residents (which equates to a bit less than 1% of the housing stock).
It’s really weird that it is showing up in the data like this, because all else is definitely not equal across all these cities.
4% rent growth in the slowest growing cities, which is the main outcome driving this pattern, is really weird. It isn’t some regional migration pattern that is driving this. It really is slow growth itself that is associated with rising rents.
The really big stories with very negative rent trends are mostly outliers and not examples of the systemic pattern. Rents declined in Denver by 1% with only 3 permit per 1,000 and increased in Fayetteville by 4% with 9 permits per thousand. Rents are down 3% in Austin with 7 permits per thousand, and while Austin is a big supply success story (largely because it leads in apartment permits, which I haven’t included here), supply probably sustainably will be keeping rents flat at best at its current building pace (which is fine! Great even! That’s what winning will look like!).
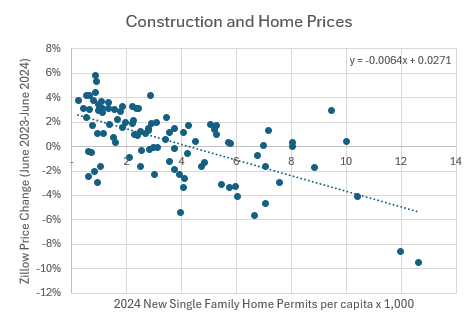
Figure 2 shows single-family permitting rates and the one-year change in prices.
When prices are changing faster than rents, that’s a signal that the difference is coming from changes in land value.
For the average city, price was up about 0.5% while rent was up about 3% over the past year. That is a short term price shift that is unlikely to have any systematic persistence.
Why am I being nitpicky?
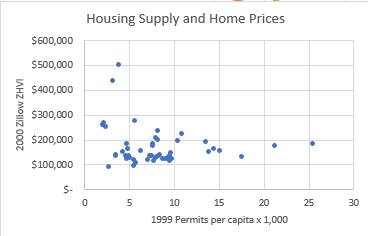
Think of the price of homes as the accumulation of all previous price changes. Here, I’m going to reach back to before all the 21st century nonsense. Figure 3 shows the permitting rate in 1999 and Zillow’s ZHVI home price estimate for 49 metropolitan areas in 2000. Those dots up at the top left are the cities I left out of Figures 1 and 2. If every city had completely inelastic supply, then the plot would just be a vertical line that those dots would be in the midst of. Almost all cities have local supply conditions that allow for new supply to equal demand over time. So, there is little difference in price appreciation between cities that permit 3 units per thousand residents per year and those that permit 25.
That’s what it looks like for more supply to lower prices. It means you don’t turn into a dysfunctional displacement factory like New York City. It means prices are unrelated to construction pace.
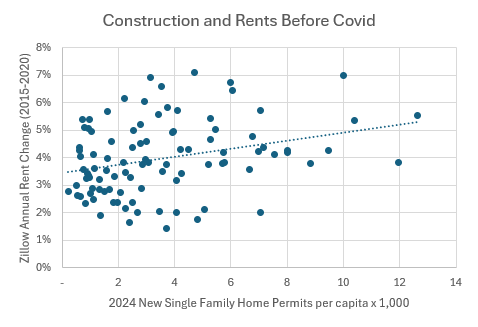
The reason 2024-2025 looks like Figure 1 is because 2015-2020 looks like Figure 4.
This doesn’t mean that from 2015 to 2020 the faster growing cities had less elastic housing supply. The slowest growing cities averaged 3.5% rent growth while permitting practically nothing. In other words, the slowest growing cities during that time (and still today) had completely inelastic supply like New York and LA, and so their dots were climbing the vertical line just like New York and LA.
So, what is happening? First, there was a mortgage crackdown in 2008. That killed prices and home building uniformly across cities. In Figure 5, Phoenix has the price spike in 2005, but indexed to 1990, Phoenix, Atlanta, and Cleveland all ended up with real prices at around 70%-80% the 1990s norm by 2011. Too cheap to encourage new construction, and thus having inelastic supply conditions.
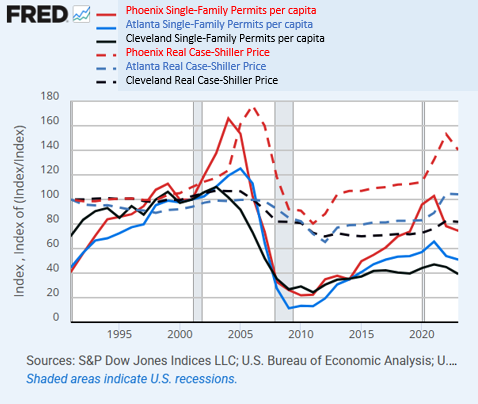
And, even though Phoenix also had the building boom that predated the price spike, compared to the late 1990s, all three metro areas ended up first dipping to around 20% of the previous rate of construction and settling in around 40% after the dust settled.
Phoenix has the most demand, so there was more rent and price appreciation there, and as prices rose, supply conditions loosened, and permits increased. Prices and rents had to rise for permits to increase.
Atlanta grew a bit more slowly, and so permits are rising more slowly there, as prices rise, but they are rising.
Growth is slowest in Cleveland. But, the scar from the mortgage crackdown hit every city at approximately the same scale, so Cleveland still is permitting new homes at the floor rate while rent continues to rise by 5% annually. Homes in Cleveland are still too cheap. Rents are higher than ever, but they have to get even higher to trigger new construction in the post-mortgage crackdown market.
Mortgage access mostly raised price/rent ratios. As Figure 3 shows, prices aren’t that different in most cities. So, mortgage access, when it was generous in the 20th century, mostly lowered rents.
I don’t know why that isn’t the lesson economists took away from the post-World War II mortgage boom and building boom, because that’s mostly what happened then. But they didn’t, so now, I guess this is news.
In an unbroken market, Figure 1 would be a bunch of dots laid out horizontally at around 2%, and we would say “See, ample construction keeps prices low so that fast growing Phoenix is no more expensive than Atlanta or Cleveland.”
We can also say that Figure 1 shows how supply keeps prices low, but we need to recognize that Figure 1 is the picture of a market several steps into being broken, now healing; not the picture of a functioning regular market.
Figures 1 and 2 look like they do because the mortgage crackdown broke housing so hard that cities can’t suddenly recreate their homebuilding market base as they return to life. They overshoot. Sort of like how Phoenix couldn’t meet demand in 2004, so prices rose in 2005.
And, new permits declined because of Covid, but clearly not because of a demand shock, as in 2006, but because of supply constraints. And, so the overshoot continued. Now finally, new homes might get built again at a pace that can stop the rent and price inflation. Because of that overshoot, there is now room for reversal. But it will take 2 to 3 new units per thousand residents above the rate needed for population growth for each 1% of rent deflation below the general rate of inflation. To get rent inflation nationwide down to zero will take more than a million units additional per year.
National capacity will slowly return to recovery and start to find its way back to cities like Cleveland. Figure 1 will slowly return to a flat line at about 2%, with some wiggles and squiggles along the way. And when it does, it will be just as much a proof of the power of supply as it is now.
PS. By the way, I happened upon this old chart that shows permitting rates among the 49 largest metro areas and per capita incomes. Notice that there was little variation in per capita income across cities in 1994. And, where incomes have become notoriously high, it has uniformly been in the cities with the least new housing permits.
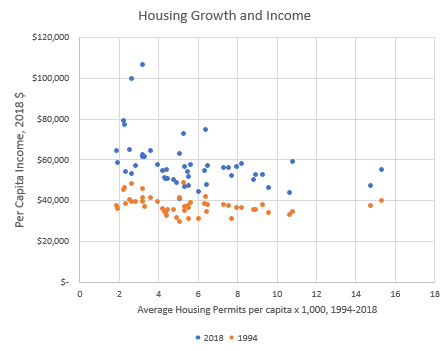
The only way to get local incomes that high is to move out the poor. And to do that, you have to stop growing. If being popular and amenity rich attracted a lot of productive and wealthy newcomers, then the dots on the right would have moved up. It would be a pretty wild coincidence if some of the slowest-growing cities with pretty regular average incomes and only the slowest-growing cities suddenly got rich because they suddenly got more awesome than the cities that had previously been growing at 5 times their pace.
If every city adopted completely inelastic housing supply, San Francisco and San Jose would probably be near the top of the vertical line of dots. New York City and LA would be pretty average. Of course they would be average. New York is the country’s largest city, by far. It should be the center for a lot of corporate headquarters and leading industries, and have relatively average incomes. Of course it should. The high incomes are its failure, not its success.
Genuine question: how reliable is data from 1980-2006 when, by the turn of the decade in 1980, we'd had about a decade of mortgage-backed-securities incentivizing the type and location of what housing was built? I don't disagree that the data seems to pretty clearly show that access to mortgages correlates with falling rents, but access to mortgages during this time period was heavily influenced by which mortgages could be packaged quickly into an MBS, regardless of whether it was a decent investment - either on the development side or the buyer side, since banks were financing both.
Phoenix is a good example. They had a 5.9% foreclosure rate in Maricopa County in 2008 - significantly higher than the national average of 1.8% and the average county rate (0.6%). (Certainly some of that is Phoenix's population, as big cities were hit harder than rural areas for obvious reasons.) Phoenix was the poster child for exurban upper middle class home development that your average Joe didn't really need or want, but that made developers, speculators, and banks a lot of money on the back-end. What effect, if any in your opinion, did this developing bubble potentially have on end price, and would you say it changes your analysis at all?
I have to admit I was initially a little dubious of your claims about the impacts of restricted credit on the supply side, so I did a little historical research. You should seriously check out the 'Stop-Go' policies of the Macmillan government in Britain. They tried to restrict credit for mortgages as a means of achieving broader macro-economic effects. It proved disastrous.
I also think there is a case that if migration isn't managed well and selective, it can lead to a massive tilt towards rentier economics. Importing low income populations is inherently reducing the percentage of the population with feasible access to mortgage borrowing. Here in the UK, as the pace of mass migration has increased, leading to what some have called the Deliveroo economy, has had a profound impact on rents, raising rents by 30% in three years. 60% of legal migration in the past 10 years has been in the low or no skilled category, and only 4% of all migrants in the past 10 years fall into the net contributor category.