Last Follow-Up to the Moral Panic... posts
I should have done this a long time ago. Keep in mind, these are broad estimates. But, I think they are interesting. And, as I frequently say, when you’re dealing with something as ridiculous and large-scale as the 2008 mortgage moral panic, you don’t have to correct your standard errors to 4 decimal points to see the conclusion.
So, I estimated the average income of Fannie Mae borrowers by taking the average home value on new Fannie Mae loans, and estimated what the income of that borrower would be based on a regression of home values against incomes in my database of US ZIP codes.
From that, I estimate that the average Fannie Mae borrower in 2007 had an income of just about $60,000 and the average Fannie Mae borrower in 2009 had an income of just about $80,000.
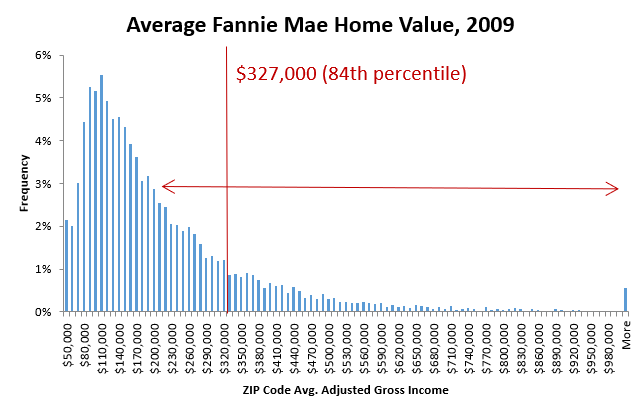
Here are histograms of the incomes of about 12,000 ZIP codes in my database, in 2007 and in 2009. And, on each chart, I have marked where the average Fannie Mae borrower falls.
In 2007, that was higher income than 71% of the ZIP codes. In 2009, that was higher income than 86% of the ZIP codes.
In very broad terms (with a wide confidence interval), in 2007, Fannie Mae was serving 60% of the country, which makes sense, since about 60% of the country own homes.
By 2009, they were only serving 30% of the country.
Actually, I don’t know why I made that more complicated than it needed to be. Here is the same analysis without bringing incomes into it. Here, I’m just comparing the average Fannie Mae home value to the average home values in my 1,200 ZIP codes. The results are similar.
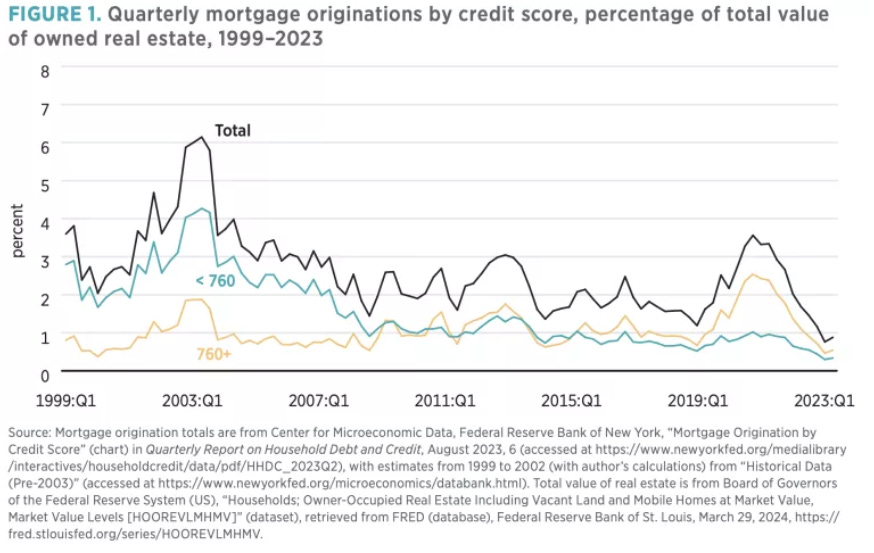
There could be some compositional issues, but the relative change in the average credit score on new mortgages at Fannie Mae was similar to the relative change in the broader market.
Over the course of 2008, you can roughly say that Fannie Mae abandoned half its market. And, that is in the ballpark of what the estimates of the change in the whole market would suggest.
“We killed half the market” is a pretty broad and concise statement to make, and it looks like it might actually be pretty accurate.
PS. I have added another follow-up post that adds some caveats to this. Maybe it’s more like 1/3 of the market rather than half.


I'm not sure I'm thinking about this correctly, but it seems like what you're highlighting here is even worse in real terms than nominal. Given the massive destruction of housing value between 2007-2009, 2007's $261,000 house could have been had for far less in 2009, and $327,000 went a really long way in 2009's market.
"We killed half the market"---I wonder if there's anyone who says that with a sense of pride; smugly convinced that they saved millions of families from the burden of a mortgage that might have been slightly higher than what they would pay in rent.
The guest post at Slow Boring by Wally Adeyemo seemed to be scratching at the idea that certain financial entities aren't delivering the goods on credit for housing purchases. Based on the numbers he was citing, the FHLB's (which you've never mentioned before) haven't been much of a player for decades. I suppose any reform helps, but if Yglesias is going to give somebody a guest post, it should be you.