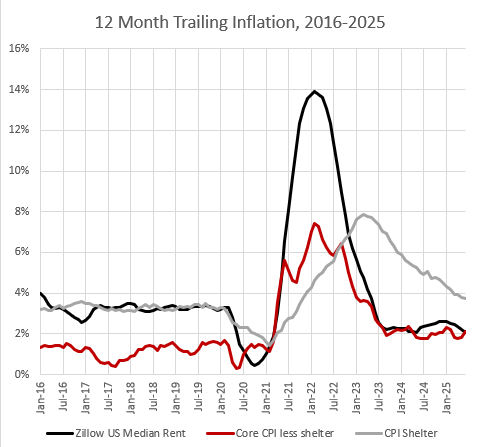
Well, that’s now 36 months in a row that JPow! has kept monthly core inflation excluding rent (which should be excluded) hewing very closely to the Fed’s 2% target while employment has grown or remained stable. Miss him when he’s gone.
More below the fold. For unpaid subscribers new to the Erdmann Housing Tracker, paid subscribers get a monthly update of the average US home price that has 3 components: Cyclical, Supply, and Credit.
In December 2005, the tracker estimated the average American home to be valued 48% (on a continuously compounded basis) above a neutral norm. Of that, 24% was from supply constraints (which at the time were largely limited to a few expensive coastal metro areas), 18% was from cyclical froth, and 7% was related to the credit boom.
Today, the average home is valued 38% above a neutral norm. Of that, 0% is cyclical, 62% is supply constraints (which are now national) and suppressed credit access is pushing prices down by 24%.
In raw numbers, the value-weighted average home price in America’s 30 largest metro areas should be $372,000. Instead it is $542,000 because of high rents from a lack of adequate supply. It would be $691,000 if late 20th century mortgage access was available. But, that’s a bit complicated, because the lack of mortgage access is responsible for much of the supply problem, so they can’t be considered separately.
“Founding” subscribers get data for each of the 30 largest metro areas.
Keep reading with a 7-day free trial
Subscribe to Erdmann Housing Tracker to keep reading this post and get 7 days of free access to the full post archives.


