July 2024 Erdmann Housing Tracker Update
Boring trends continue. Rents continue to rise faster than general inflation. Prices remain stable.
This month, I analyzed 1,200 ZIP codes that have Zillow rent (ZORI) estimates since 2017 and IRS income estimates.
Figure 1 shows the monthly rent for the ZIP code with the average income and average density. (I have not controlled for metro area effects or anything like that here. In the current context, the general trends should not be affected much by that.)
Basically, the housing shortage economy continues. Rents basically followed the rise and then stabilization of general inflation, with a consistent premium added.
But, that premium is regressive. Average incomes have risen about 46% over this time. Rents in the richest neighborhoods (here, ZIP codes with avg. income about $250,000) have also risen in line with incomes, about 45%. But, rents increased about 55% in poorer neighborhoods (here, ZIP codes with avg. income about $60,000).
This suggests that the regressive rent inflation I have previously noted, which created a massively regressive trend in disposable income after rent from 2015 to 2021, continues. Low end wages have been rising strongly recently. It appears those wage gains, on average, may still all just be going to rising rents.
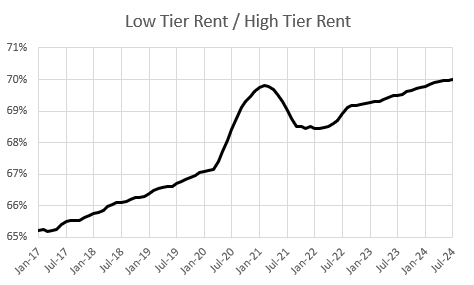
Figure 2 compares the rent in the average ZIP code among these 1,200 with $250,000 avg. incomes vs. the average ZIP code with $60,000 avg. incomes. In January 2017, the typical rent in the rich neighborhood was 54% higher than in the poorer neighborhood. Now it’s only 43% higher.
Rents in poorer neighborhoods keep rising, and the difference between what rich and poor must pay keeps shrinking.
This can’t go on forever, but it appears to continue.
About 1.5 million new homes are currently being completed annually in the United States. The sustainable number of units is higher than that. The current rate of construction is socially untenable.
Some more details about rents and this month’s numbers, below the fold for subscribers.
(PS. Sometimes, I wonder about myself. Here is Figure 2a, which is Low Tier Rent / High Tier Rent, which is obviously much more intuitive.)
Keep reading with a 7-day free trial
Subscribe to Erdmann Housing Tracker to keep reading this post and get 7 days of free access to the full post archives.


