In spite of representing approximately 0.2% of the American housing market, it is common to see Boise mentioned in today’s housing news. Boise fits the mold of the bubble city that is, understandably, a popular focus today. Here’s a link to a recent example at CBS. The analysis is measured and reasonable. They mention the supply problem. In that piece, they aren’t screaming that the sky is falling. They even recognize that inadequate supply will support home prices, to an extent.
My Housing Tracker is meant to help answer the question hovering over the CBS piece, which is “what is the relative scale of the supply tailwind vs. the cycle headwind in the housing market?” And, though Boise is too small for me to use in the specifications of the tracker, and doesn’t have a lot of local Zillow valuation estimates that go back far enough for me to analyze it during the Great Recession, it does present an interesting picture of market conditions today.
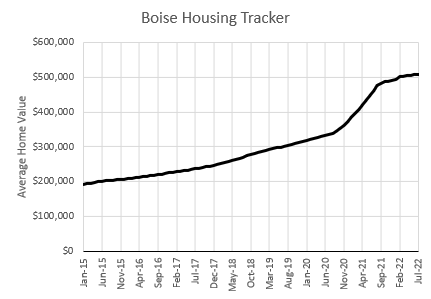
The price boom, according to Zillow, was really a pretty short burst from late 2020 to late 2021. Since then, prices have continued to rise moderately, on average, in Boise, for another year.
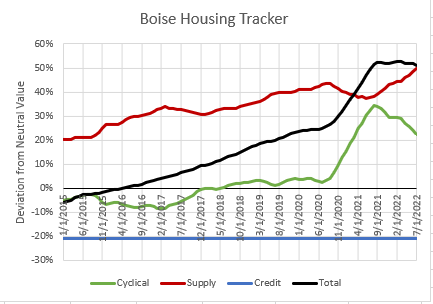
My model says that in late 2020, the average Boise house was overvalued by about 25%, which was mostly a combination of a 40%+ supply premium and a 20% credit discount, with no cyclical froth. Suddenly there was a cyclical boost of about 35%. But, notice, the cyclical boost peaked in August 2021, and has fallen pretty significantly since then. A combination of rising rents from lack of adequate supply and rising incomes (boosted by recent inflation), kept prices rising in spite of the cyclical reversal. A third of the cycle has already reversed! Another two years of that could wipe out the entire cyclical boost without any actual price drops.
The cycle isn’t just turning in Boise in September 2022. The cycle has been unwinding, peacefully, for a year already.
Here is what my model says about a hypothetical ZIP code in Boise with income 40% (50 log points) below average (about $50,000 today) or 65% (50 log points) above average (about $136,000 today). In the lower-income ZIP code, home prices were already more than 30% inflated before 2020, in spite of a credit-induced discount, because of inadequate supply and high rents. In the high-income ZIP code, they were inflated by less than 20% because supply constraints don’t affect prices as much in those neighborhoods.
Now the low end is inflated by about 60% and the high end by about 40%.
The trend in the Supply component in Boise is relatively typical, which is to be expected. The factors that have led to rising rents and stress-inducing housing costs since 2007 have mostly been due to Federal level policy choices, which have affected most places similarly.
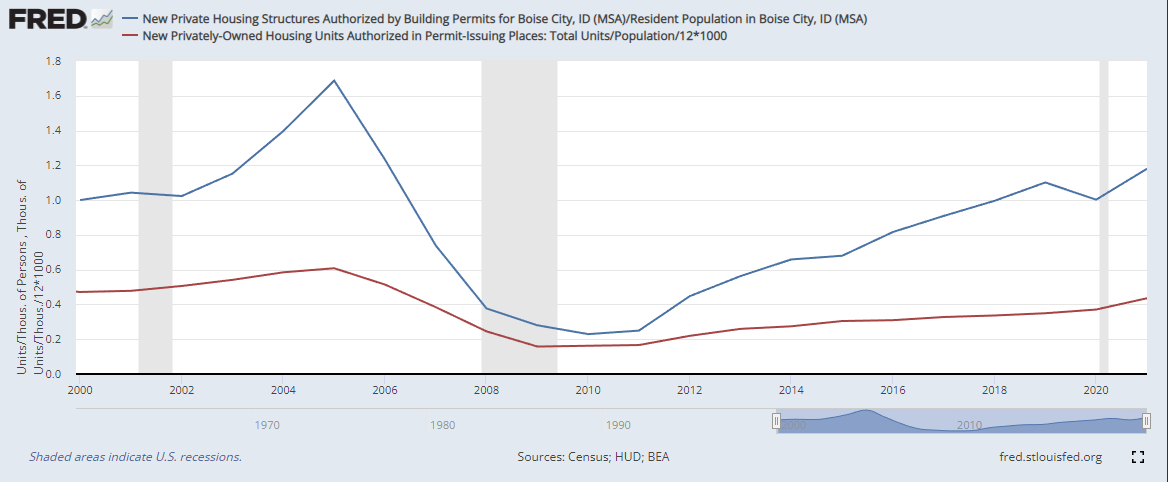
As Figure 4 shows, Boise (blue) regularly builds more homes per capita than the US average (red). However, there has been above-average demand for living in Boise, so Boise population growth has outpaced housing growth, relative to the US average. (Figure 5 shows the number of new residents per new home each year rather than homes/capita. Here a higher number means fewer homes per new resident.)
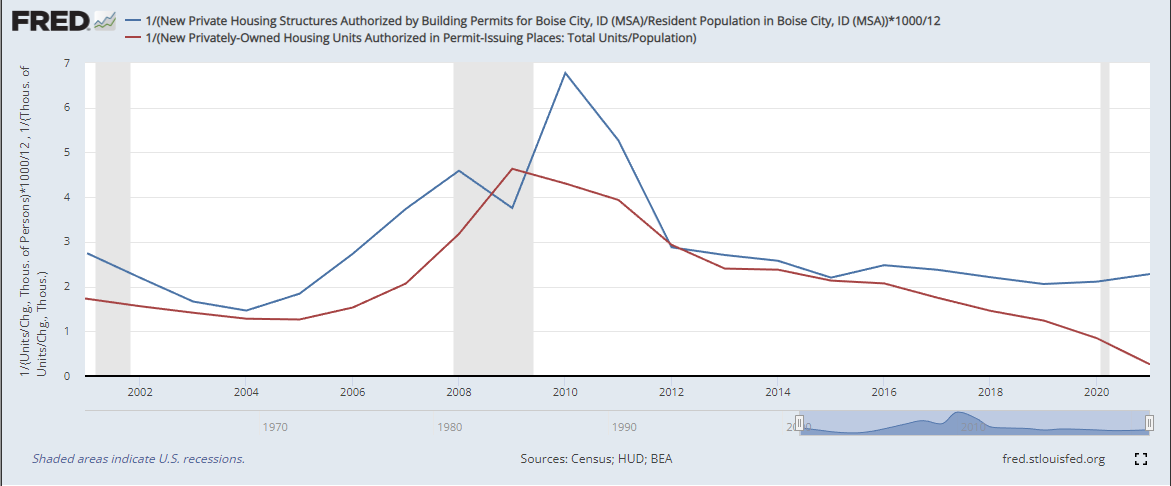
Boise has been building more homes because relatively more people are moving there. You might see some people argue that the US doesn’t have a housing supply problem because new homes per capita and even total homes per capita have increased in recent years. As Figure 5 highlights, this is mostly due to recent lower population growth in the US (mostly from declining immigration and Covid-related excess deaths). The red line is declining because population growth has recently been unusually low. But, as you can see, in growing places like Boise, housing production is still at cyclically low levels. Where growth is happening, housing isn’t keeping up. (And, much of the inducement for regional growth is due to people moving away from places that lack adequate housing because of decades of underbuilding.)
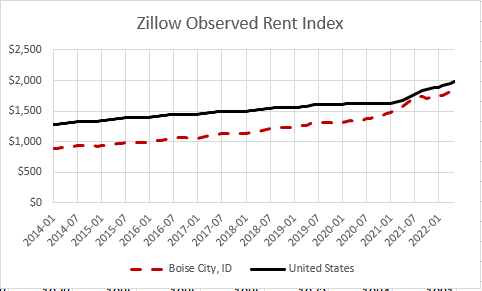
So, in spite of its higher construction activity, rent inflation has been higher than average in Boise. (See Figure 6.) As with many housing trends, this was the case before Covid, and Covid may have accelerated it.
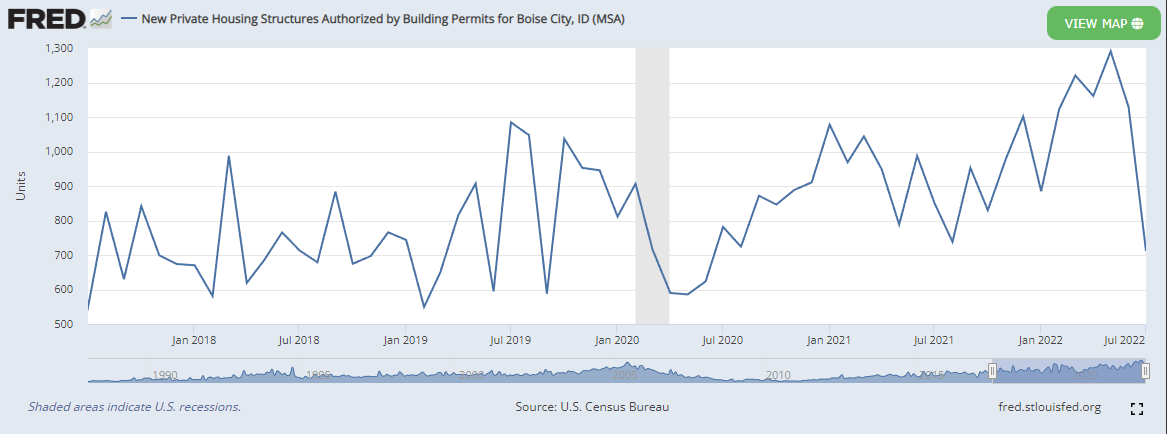
Figure 7 shows recent monthly housing permits in Boise. This can be a bit noisy. In general, this shows that construction has continued to rise even in the year since the Cyclical price component has been receding. The last couple of months have seen a sharp decline, but this isn’t that unusual. It will take some time to discern new trends from noise. U-Haul rates are still much higher into Boise than out of Boise, so I don’t think this is a reflection of a sudden downshift in population growth or demand for shelter. If permits continue to fall in Boise, it seems probable that it will follow a similar pattern as the boom cities from 2005 to 2007, with a declining Credit Component and a rising Supply Component, averaging out to a stable trend for the average home.
.
So, Boise provides a great example of several common aspects of the housing market today.
There is no reason why a reversion of cyclical trends needs to include nominal declines in prices of a scale that would be discernable from normal seasonal patterns and market noise.
There is no reason for September 2022 or October 2022 or March 2023 to be the month where the Boise “bubble” finally pops and suddenly we all see that nominal home prices will collapse by 20% or 30%.
There is definitely no reason to try to fix the housing market in Boise by killing off demand for owning or building new homes.
The average home in Boise will eventually become affordable by building more - in Boise and in California. In fact, that’s the only permanent way to do it. A drop in housing permits in the near future would be antithetical to a Boise that is more affordable in any meaningful sense.
Number 4 is especially true for the rents and prices of homes whose tenants have lower incomes.
A drop in population growth and in-migration before 2008 were coincident indicators of functional cyclical unwinding and forward indicators of disruptive unwinding. Even that doesn’t appear to have happened yet in Boise. I didn’t go into it in this post, but the evidence from 2005-2010 suggests that even if demand collapses so severely that migration trends also collapse, even that will likely be associated with relatively stable prices (partly held up by a newly rising Supply component) unless it is associated with a credit shock. And the credit shock of 2008 was a one-off event that can’t really be repeated.
After looking more closely at Boise, I’m a little more confident that it is already well into an orderly cyclical normalization.
That is not necessarily the case for other metro areas, some of which have a higher Cyclical inflation than Boise, which have not been reverting for a year, though, from a policy perspective, my conclusion would be the same. There is no reason to aim for anything but a “soft landing” with minimal nominal price declines. The only reason anyone expects or demands such a catastrophe is because the full costs of constrained supply are so poorly appreciated. Boise is a good example. If the average home price in a city is inflated by 80%, it is tempting to want to kill demand for housing until it goes to zero. But, if 50% of that is because of constrained supply and high rents, we’re just going to add poverty to poverty in a failed attempt at getting to zero, which is basically what we did after 2007. One sure way to make housing unaffordable is to keep imposing poverty on your community in order to make prices decline. It’s an unfortunately popular, and bipartisan, prognosis, though it is usually held behind enough fun-house mirrors of economic reasoning not to be readily recognized in such blunt terms. We should hope that fewer of its proponents have their hands on the levers of financial power than in 2008.



As usual, great stuff.
In housing, "Build it and they will come."
Well, anywhere along the West Coast, for sure.