August 2024 Erdmann Housing Tracker Update, with inflation notes
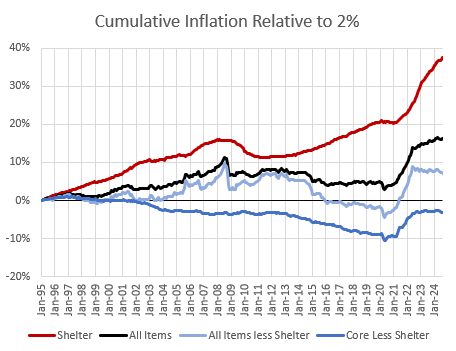
Since July 2022, CPI inflation excluding shelter has been running at 2% annually quite regularly, and shelter inflation has been running at a higher rate much like it has been for 30 years.
It is tough to pick out changing trends in real time since price data is a bit noisy from month to month, but it looks to me like we are starting to slip back into a 2013-2019 pattern where aggregate CPI runs at 2%, but it’s associated with shelter inflation of about 3% and non-shelter inflation of about 1%. Nominal GDP growth was regularly below 5% during that period, and it will probably slow to below 5% again if this trend sticks.
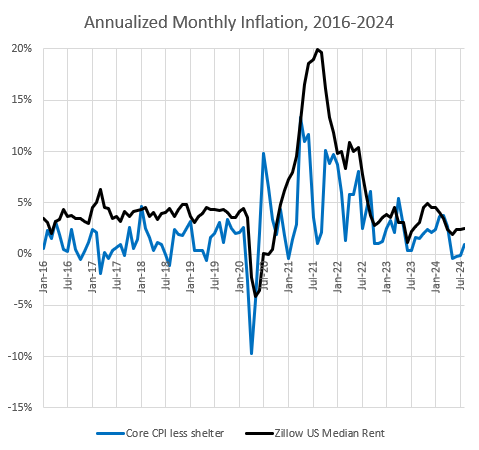
It is possible that home construction has remained positive enough that shelter (rent) inflation could settle in below 3%, and maybe decline from there if housing completions can rise from here. Figure 2 of monthly price trends suggests this possibility.
The 12 month trailing trends give the opposite picture, but the rise in Zillow rent is mostly from 6 to 12 months ago. Figure 3 also shows the trailing 12 month change in the CPI shelter component, and it is still just giving a lagged reading of actual rent inflation. Using the Zillow rent measure, one can see that rent inflation has largely reflected the longstanding pattern of mostly just being non-shelter inflation + 2%.
Figure 4 clarifies that. There were a couple of blips along the way, but since 2015, annual excess rent inflation has pretty steadily been about 2% and it’s still in that vicinity. It’s still too soon to tell if it might diverge from that trend and flatten out a bit or continue along that 2% trend.
Figure 5 compares Zillow’s US median home price estimate (ZHVI) and its rent estimate (ZORI). Training price changes to rent changes from 2015 to 2019, home prices have continued to be completely driven by rents, with only some small variations.
Rent reflects the long-standing housing shortage plus transitory inflation in 2021-2022. Prices reflect rents. Nothing to see here. Move along.
Inflation expectations have declined recently, again basically back to levels typical of the post-Great Recession period. Lower than I would like to see, but nothing catastrophic, yet.
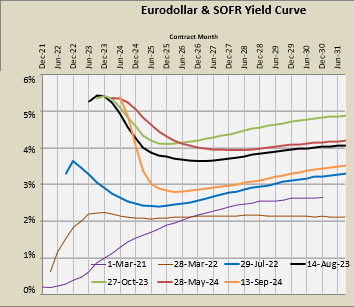
I would say the same about the yield curve in Figure 6. This shows the yield curve at several points in time since spring 2021. It was very recessionary in early 2022, which is one reason why the Fed was wise not to try to slow the economy down even more when real growth stopped and inflation spiked in early 2022.
Moving to the July 2022 yield curve, you can see that the long end of the yield curve steepened as transitory inflation ended. By then, the Fed was probably raising their target rate higher than it needed to be, creating that strange hump on the short end that has been there since. So far, that doesn’t seem to have mattered too much.
For the past year, the yield curve has generally kept a similar level and shape. The recent drop worries me. The long end of the curve is still nicely upward sloping. But that expected drop is steep. The Fed needs to meet expectations about that dropping rate. If they are slow, we might end up back at the 2018-2020 situation where we are tempting recession. What I don’t want to see is the yield curve continuing to decline with the Fed chasing the declining neutral rate back to zero.
I don’t think that has to end up in a terrible place. The Fed has a lot going for it, including some capacity constraints that still have room to loosen, raising real growth. And, I definitely don’t think it matters much to homebuilders. Even if the long end of the yield curve drops from the 3% range down to 1%-2%, home building will probably still be hitting its current capacity constraints. Completions aren’t going down from here unless things get really, really bad.
If that’s where things are going, non-shelter inflation will probably decline to less than 1%. I’d like to see the yield curve move back up and non-shelter consumer inflation rise toward 2% again. In that case, prices of residential construction inputs will probably remain elevated, which is just fine because builders are already giving a lot of incentives to keep new home prices level while margins are high and costs retreat somewhat.
A neutral inflation policy right now probably will be associated with inflation in residential investment. That’s ok. That can normalize later. On the cross-sectional distribution, residential construction inputs are going to be on the high side, or at least they are going to be slow to reverse the remaining transitory inflation. On the other hand, if capacity can finally rise and completions can rise, rent inflation might, finally, stabilize after decades of excess. Then, fingers crossed, maybe rent inflation can even start to reverse.
The updated tracker numbers and some comments on mortgage affordability are below the paywall.
Keep reading with a 7-day free trial
Subscribe to Erdmann Housing Tracker to keep reading this post and get 7 days of free access to the full post archives.


