21 Century Housing Summary, Missouri Edition
Here, I will work through the basic building blocks of a simple review of the 21st century housing market.
Canonized points about the housing market and the 2008 financial crisis are wrong on basic foundational details. These mistakes apply fairly universally, from Cheyenne to Chattanooga. So, today, I decided to grab a region, at random, and walk through the basic fundamentals.
Missouri, it’s your time to shine.
There Was A Price Boom before 2008
As Figure 1 shows, home prices in Missouri did rise from the late 1990s to the mid-2000s. By about 10% relative to per capita income and about 30% compared to median household income. The truth is probably somewhere between those two numbers.
Home prices did go up.
The real Case-Shiller home price index for the U.S. (Figure 2) that was widely shared back then as evidence of the bubble shows an 80% rise. That’s a lot higher. That’s because the Case-Shiller index was the combination of a few regional markets that had risen even more than that and a lot of markets like Missouri.
One reaction that I think is common is to take the Case-Shiller number as a reasonable (though mostly wrong) sign of a bubble and then lose sight of the scale when considering places like Missouri. Once the bubble was the thesis to be confirmed (and why wouldn’t it seem to be after you saw Figure 2) then the price variation in Figure 1 was plenty to serve as confirmation bias.
Yet, Figure 1 actually looks exactly like the “normal” Case-Shiller behavior from 1894 to 1997. Prices in Missouri did not actually confirm the bubble thesis made so salient by the national Case-Shiller measure.
There Was A Lending Boom
In one of my Mercatus papers, I looked at various factors associated with changing home prices from 2002 to 2006 and from 2006 to 2010. I found a significant importance for credit access. Figure 3 uses data from that paper.
ZIP codes in St. Louis where the FHA had a high market share in 2002 and where denial rates on mortgages were high in 2002 saw as much as 20% price appreciation from 2002 to 2006. On net, that was the entire reason for the rise in home prices in St. Louis. Other factors netted out to a slight decline, relative to incomes.
St. Louis had a lending boom from 2002 to 2006, which then mostly reversed from 2006 to 2010.
I sometimes say that there was a lending boom in the 2000s. It was a mole hill on the side of a supply crisis mountain.
Since Missouri didn’t have a supply crisis, the mole hill really was the whole game. You could say that housing in the 2000s in Missouri really could be described, strictly, as a credit boom and bust. And it produced a rise and fall in home prices that fits easily into the normal ups and downs of a century’s worth of Case-Shiller estimates.
Every place from Cheyanne to Chattanooga, whose market can be described thoroughly as simply a credit boom and bust, fits easily into the normal ups and downs of a century’s worth of Case-Shiller estimates.
There Wasn’t a Big Building Boom
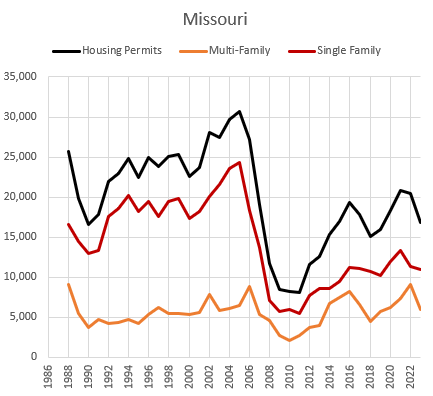
In Missouri, about 25,000 homes were constructed annually in the 1990s. From 2002 to 2006, shown in Figure 4, the average was closer to 30,000 homes annually. That’s about a 20% rise in production, which isn’t nothing as a change in construction activity.
But, in the 1990s, Missouri was growing by about 1% annually, and this boost in activity didn’t even accumulate to a 1% increase in the size of the stock of housing.
Again, another signal of boom times. But, nothing outside of the old normal Case-Shiller days. Certainly not enough to call for significant changes in supply and demand conditions in Missouri.
Given the evidence so far, one could reasonably infer that looser lending conditions had pushed Missouri home prices a few percentage points higher, on average. But little else of note begged for policy responses.
Interestingly, rents had been rising in the years leading up to the 2002-2006 boom years. Then they had leveled off by 2005. Perhaps prices were increasing because a small increase in production was overdue. And, the small increase in production was enough to stabilize rents.
Figure 5 shows trends in rents in Kansas City and St. Louis relative to the core consumer price index.
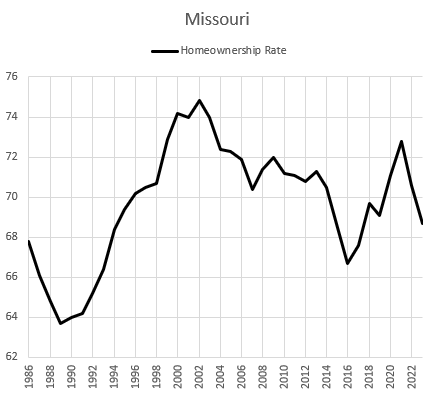
Oddly, though, considering the apparent importance of credit access to rising home prices in Missouri from 2002 to 2006, homeownership peaked in 2002 and declined in following years. (Shown in Figure 6.)
The lending boom was not associated with a rise in homeownership.
What does the bust tell us?
It is common for conventional reviews of the housing “bubble” to explicitly or implicitly interpret the bust as a confirmation of whatever the researcher claims caused the “bubble”. It seems to confirm buyer over-optimism, temporarily inflationary pressures of loose lending, the effects of overbuilding, etc.
Certainly, prices declined after 2006. But, while rent inflation had moderated during the building boom, rents actually were pretty firm after 2006 (Figure 5). There isn’t an obvious signal of overbuilding or a chastening of investors from falling rent income. Multi-family construction declined much less than single-family construction did, and recovered much faster (Figure 4). There was an economic motivation to build homes after 2008.
Vacancies (Figure 7) were slightly elevated from 2005 to 2010. But, Missouri’s vacancy rates didn’t move much. Usually, vacancies and rents move in opposite directions, and having a high, but not too high, level of vacancies is an important factor keeping rent moderate.
All considered, the slow rise in rents in the 1990s is a plausible consequence of a 10% rental vacancy rate. The approximately 12% rate from 2005 to 2010 is plausibly associated with stabilizing rents. And the lower vacancy rate since then has again been associated with rising rents (Figure 5).
In other words, the Missouri housing market leading up to 2008 was working like a textbook. Capital was flowing into new housing at a moderately higher pace, and it led to moderation in rents. Moderation in rents is usually associated with moderate increases in vacancies. Left to its own devices, moderating prices surely would have followed.
Moderate is the key word here, in all regards.
Act 3
What happened later wasn’t moderate at all.
Home prices declined to unusually low levels. In the end, single-family home construction permanently fell to unprecedented lows and remained there. Rents increased. And, finally, prices eventually turned back and moved up, following rising rents.
Something else that wasn’t moderate was population growth. Suddenly, at the same time housing production crashed, population growth crashed in Missouri. Figure 8 shows Missouri home permitting rates and population growth.
This was an important aspect of the cities I call the Contagion cities (cities in Florida, Arizona, etc. that had more of a price bubble before 2008 than Missouri did). In those cases, population growth stalled when inmigration from other cities dried up. Possibly the mortgage crackdown and the collapse in housing production affected migration into or out of Missouri or even childbearing.
Several measures are in Figure 9. The black line is the combined vacancy rate. The red line is housing permits as a percentage of the stock of homes. I like to show these measures on the same scale. It helps to get the point across that it basically would be impossible to cause a spike in vacancies or a supply glut because of elevated construction activity.
Housing supply operates on a slow twitch. It would take years to change housing supply so much that vacancies change in a meaningful way. And, that’s what we have done since 2008. The vacancy numbers are a bit noisy, but over the course of a decade, even with Missouri’s very low population growth, the combined vacancy rate has declined by about 2 percentage points. That is from very low production levels accumulating a shortage by an additional fraction of a percentage point each year.
It will take years to get back to anything that was previously normal. The rate of production before 2008 was certainly not capable of suddenly creating a glut of homes that would lead to a market collapse.
This chart also includes price trends for the cheapest 20% of Missouri ZIP codes and the most expensive 20% of Missouri ZIP codes.
First, note the relationship with low vacancies. The recent rise in prices well above previous levels has been associated with the very low vacancy rates.
Also, of note, still to this day, high-tier housing in Missouri (where buyers can still get mortgages) is still moving near the range of prices in the Case-Shiller olden-days.
Low-tier housing in Missouri, that largely lost its buyer access to mortgages after 2008, first moved to the Case-Shiller olden-days low range associated with the Great Depression, down 40% from the 2006 highs.
Much of that extra decline in low-tier prices happened after 2010 in Missouri. In the paper I referenced above, I used the 2002-2006 and 2006-2010 time periods in order to follow the convention on analyzing the housing market. By using those time periods, my analysis missed most of the damage.
Figure 10 uses the same data as Figure 3. Here, the black line is the one-year price change for a house in a hypothetical ZIP code in the 95 percentile for FHA market share, previous mortgage denial rates, non-local buyers, and previous price trends. These are the 4 variables I used in that paper as proxies for credit access and speculative activity. The blue line is a hypothetical ZIP code with no sensitivity to any of those issues - all local buyers, no FHA loans, and no mortgage denials.
As noted above, from 2002 to 2006, prices in ZIP codes that were more dependent on generous lending did rise a bit faster than in other ZIP codes.
Notice that in the ZIP code with no credit sensitivity, there was never any significant price drop after 2007.
There were deep cuts in the credit-dependent ZIP codes. The deepest cuts in Missouri came after the period researchers looking for causality in price trends have typically reviewed and that I reviewed in Figure 3.
In 2011, home prices declined by more than 20% in credit-dependent ZIP codes. More than double the rate of price collapse in any previous period. Nationally, the credit tightening clearly happened in 2008 - in terms of the credit scores of new buyers. In 2009 and 2010 there was a generous first-time homebuyer credit that probably boosted prices. And, in 2010, Dodd-Frank passed. It’s hard to know how much each of those factors had to do with the 2009-2011 price trends, but they were likely important.
More to my broader point, the pain we imposed on working class homeowners wasn’t just the result of bad policy choices. It was the result of the relentlessness of those policy choices. And, since those policy choices were so relentless, the evidence of the damage is clear. The 20% drop in credit-dependent home prices in 2011 very obviously was not the result of overbuilding in 2006, falling rents, rising vacancies, etc.
For Missouri, and for many other regions, the deep drop well after 2008 was the first time they had reached unusual price levels in real home values compared to the long-term real Case-Shiller trend. The unusual price move was to the downside, not the upside. And, I would be very surprised if you can find an e-mail chain, a message board discussion, or a news article anywhere that was passing around that “real Case-Shiller index” type of chart with concern and consternation about how unusual those low home prices in low-tier Missouri were.
The Tea Party appears to still have active chapters in Missouri. It had formed in early 2009 with the motivation of making sure underwater homeowners suffered maximum harm. Occupy Wall Street was just getting its feet wet in September 2011, to complain about predatory lenders, when credit-sensitive Missouri was hitting its price trend nadir. Prices would continue to fall for a couple more years, though not quite as fast as they had in the months leading up to the protest.
Finally, note that low-tier and credit-sensitive prices then moved well above the Case-Shiller olden-days range after vacancies dropped. Notice how in the previous period, from 2002 to 2007, low- and high-tier prices moved up and down together. It was only after 2007 that they separated. The initial separation was from credit tightening. Then the separation on the way up was due to rent inflation and low vacancies, because credit tightening had greatly reduced the rate of new building, and supply shortages always raise rents regressively.
As I write about often, persistent supply shortages create a distinct pattern in the market. Price appreciation is negatively correlated with incomes. That is because rent inflation from short supply is negatively correlated with incomes. The lack of adequate housing forces families to make compromises, and those compromises are always harder for families with fewer resources. In many cases, they have to just pay rising rents because there aren’t any remaining margins on which to compromise.
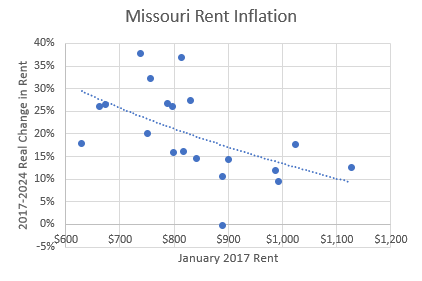
Zillow only has rent data back to 2017 on a handful of Missouri ZIP codes, but Figure 11 shows the change in real rents. You may wonder why the seemingly moderate rent inflation from Figure 5 has led to such high prices in low-tier Missouri housing. It’s because rents on low-tier housing have gone up much more than on high-tier housing.
First, low-tier prices declined but rents really didn’t. Then, low-tier prices shot up because rents shot up.
To a first approximation, Missouri had a molehill of a lending boom, and then they had a mountain of a moral panic. And that’s basically the whole story. And now they do have a mountain of a supply shortage, because of the moral panic.
Figure 12 compares the real Case-Shiller with an estimate of Missouri home prices until 2002, then Missouri home prices in the top and bottom quintile after 2002. Now Missouri looks like the Case-Shiller index. Or at least the formerly most affordable ZIP codes in Missouri do.
Depending on what region you pick for the first phase, there are a few different stories to tell (Closed Access, Contagion, etc.). But, the second part is the same story everywhere. A moral panic.
At least some places had the ingredients for creating a moral panic. A lot of places like Missouri were just moseying along with very normal, boring housing markets. And they got the moral panic stuff anyway.
Sorry, Missouri.


You briefly mentioned “maybe even birth rate“ was affected. That seems highly probable to me.
We spent a couple generations telling people, culturally, that what you do is get a job, then get married, then buy a house together, then have up to one kid per available child bedroom.
As a millennial who entered the job market in 2007, the life experience of basically everyone my age is the feeling that the goal posts were always moving further and further out of reach, and that each of us one by one had to decide to either give up on having a family, or go ahead and have kids without having met the cultural expectations we were supposed to meet.
My kids share a bedroom. This is fine, they don’t mind, and I don’t mind. We have a good life! But if this comes up in conversation a lot of adults react with a mix of sadness, pity, or disapproval. Those poor kids, or something.
I think a lot of people feel that they simply cannot have children if they cannot achieve those cultural checkboxes. And so a lot of households are having 0-1 kids these days.
Figure 4 can be used to discuss a simple counterfactual about housing production. Permits seemed to have a natural rate of 20,000 a year and prior to 2005 were exceeding that by a few thousand a year. If the Fed hadn't decided to go nuclear on the housing market then there would have been a natural correction in permits after the "boom" to probably 18,00 for a few years. Instead, the credit slaughter resulted in the destruction of homebuilding capacity and sales for the next ten years and counting.