


2024 3Q GDP

JPow!, of course, keeps winning. We just keep saddling up to a new 5% nominal GDP growth trend, with 3% real growth and 2% inflation. We overshot by about 4% after Covid and then just settled right into the new trend. Beautiful. I’ll take it, with bells on.

Figure 2 shows the nominal GDP level compared to a 5% trend. Give me the blue line over the red line all day.

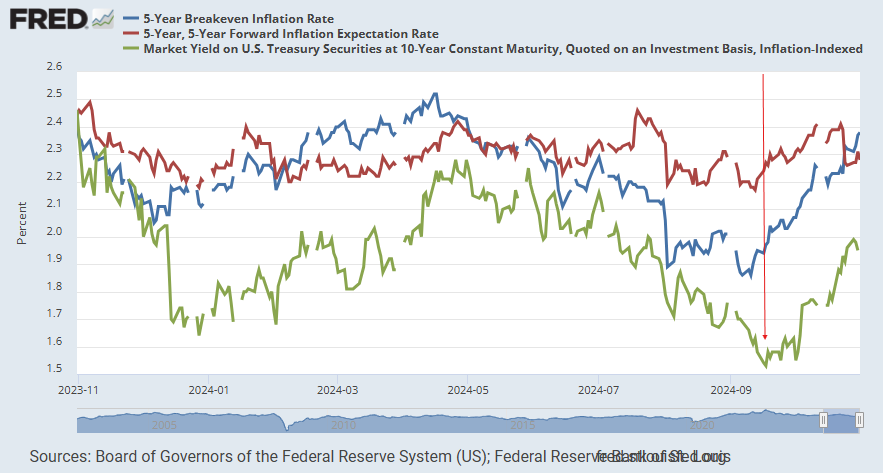
Inflation is anchored, and inflation expectations are anchored. Before the 50 point rate cut in September, inflation expectations were even getting a bit on the low side. Since the cut, both real rates and inflation expectations have risen.
Don’t be led on by the interest rate fixation of analysts and insiders. This is very bullish for the economy and for the homebuilders. In Figure 3, the green line is the real yield on 10-year treasuries. The blue line is 5 year inflation expectations. The red line is forward inflation expectations. (These are based on the CPI, which tends to run a few 10ths higher than the PCE inflation level, so these should run a bit higher than 2%.)
I’ll get into residential investment trends below the paywall.
Keep reading with a 7-day free trial
Subscribe to Erdmann Housing Tracker to keep reading this post and get 7 days of free access to the full post archives.